BankNifty Analysis Today: Levels, Catalysts, and Setup Reads
BankNifty analysis today with key levels, technicals, sector catalysts, and execution reads for intraday and swing traders on NSE.
If you opened Bank Nifty before the bell and saw it hovering near a pivot instead of breaking out cleanly, you're not alone. The better question on a day like this isn't whether the index looks “strong” or “weak” in isolation, it's what moved the tape, which stocks did the heavy lifting, and whether the move was broad or concentrated.
Table of Contents
- What BankNifty Analysis Today Actually Means
- Reading the Daily Bank Nifty Snapshot
- Higher Timeframe Technicals in Plain English
- Intraday Pivot Reads and Volatility Context
- Why Bank Nifty Moves Can Mislead You
- Catalysts, Attribution, and the SEBI Posture
- Putting Together a Daily Bank Nifty Read
- Practical Questions About BankNifty Analysis Today
What BankNifty Analysis Today Actually Means
A retail trader in India often opens the chart before 9:15 AM IST and sees Bank Nifty sitting near a pivot, not making a clean move either way. That's exactly where banknifty analysis today matters most, because the job isn't to guess the day, it's to read the tape in layers.
This Bharatstox market news hub is a useful companion when you want the bigger index and sector context, but your workflow stays the same. You start with the snapshot, move to the chart, then check which banks are leading or lagging, and finally fold in the news flow and any attributed analyst view.
Practical rule: one index quote rarely tells the full story. A Bank Nifty move can look decisive on the headline and still be driven by just a couple of heavy lenders.
That is why this kind of reading is a reporting template, not a trade call. Every specific target, level, or view later in the story should be traced to a named public source or a clearly attributed research page, never to a vague market whisper.
The working checklist is simple. First, read the snapshot. Second, read the technical structure. Third, read the constituents. Fourth, read the catalysts. If you keep those four jobs separate, you avoid the common mistake of treating a noisy opening move like a full trend change.
Reading the Daily Bank Nifty Snapshot
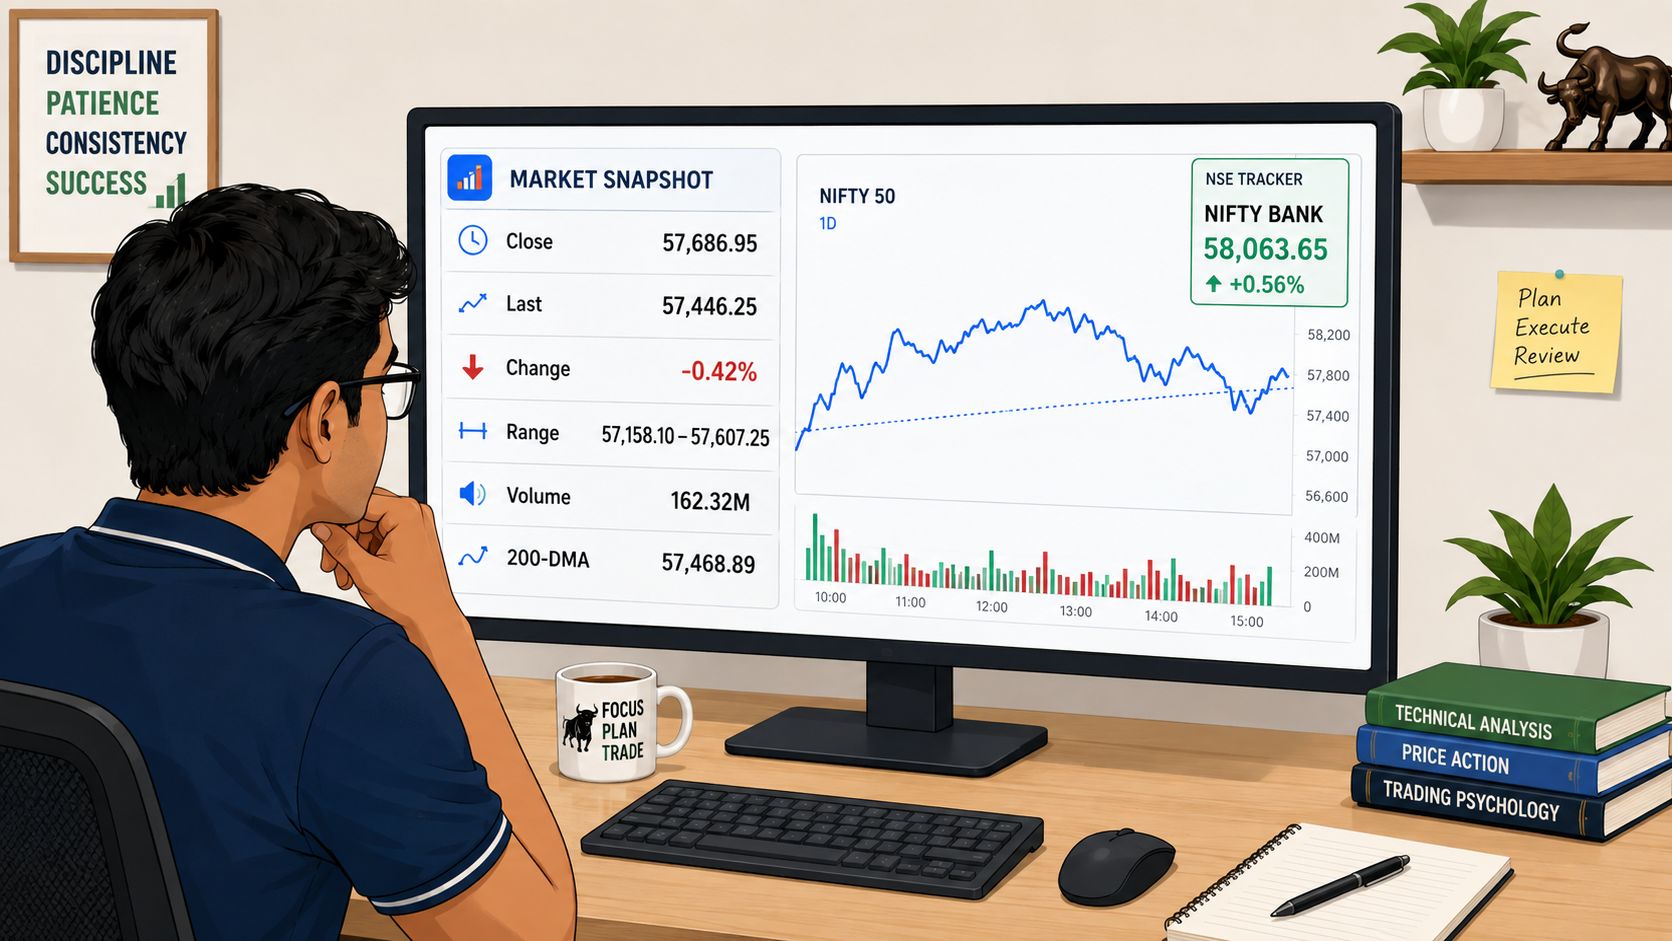
Start with the live quote. It tells you whether the index is steady, stretched, or already under pressure before the session has settled. A TradingView snapshot showed NIFTY BANK at 57,446.25, down 0.42% from the previous close of 57,686.95, with a day range of 57,158.10 to 57,607.25, volume of 162.32 million, and a 200-day moving average of 57,468.89 TradingView BANKNIFTY snapshot.
The previous close and the live price serve different jobs. The previous close marks the end of the last full session, while the current price shows where the market is trading now. The day range shows how far the index has already moved, and volume shows whether that move has broad participation or is playing out in a thinner tape.
The 200-DMA works best as a reference line, not a trigger by itself. With price sitting near 57,468.89, the index appears to be trading around a watch zone rather than breaking away cleanly TradingView BANKNIFTY snapshot. That kind of position often calls for patience, because price can hover around an average without resolving right away.
The day range adds another layer. A relatively active range with only a modest percentage move does not automatically signal weakness. It can also mean the market has already absorbed a fair amount of intraday two-way trade, with buyers and sellers still contesting direction.
A broader market check gives that reading some context. The NSE index tracker showed NIFTY BANK at 58,063.65, up 323.70 points or 0.56% in the same broader session context NSE NIFTY BANK tracker. Time stamps can differ between sources, so a trader should always note when the data was captured rather than treating every screen as if it were frozen at the same moment.
For readers comparing Bank Nifty with the wider market, this Nifty 50 live read helps frame whether the move is index-specific or part of a broader risk tone.
Higher Timeframe Technicals in Plain English
A stretched chart can still sit inside an intact trend. TradingView's BANKNIFTY technical snapshot showed RSI(14) at 72.88, ADX(14) at 35.80, and moving averages EMA10 57,627.39, SMA20 56,720.10, EMA50 56,155.66, and EMA200 54,328.18, all flagged Buy TradingView BANKNIFTY technicals.
That reading matters because higher-timeframe charts often show where the market is already extended before they show where it might turn. For traders comparing broad index behavior with stock-by-stock leadership, this sector rotation explainer helps explain why a strong index can still mask uneven participation underneath.
RSI tells you about stretch, not certainty
An RSI reading above 70 is usually treated as overbought. It does not mean price must fall on the next candle. It means momentum has already run hard enough that fresh upside can become harder to extend without a pause.
Key takeaway: overbought means stretched momentum, not an automatic reversal signal.
That distinction matters in Bank Nifty because a strong trend can stay extended for some time. If buyers keep stepping in on dips, the market can remain strong while the oscillator still looks overheated.
ADX and moving averages show trend quality
The ADX(14) at 35.80 points to a trend that has enough force to matter, rather than a flat sideways patch TradingView BANKNIFTY technicals. In practical terms, the market is not drifting aimlessly, it has enough directional energy for trend-following behavior.
The moving-average stack adds another layer. When the shorter, medium, and longer averages all point in the same direction, the chart is showing that the trend filters are still aligned. That does not make the next move easy to trade, but it helps explain why dips often find buyers in a structurally bullish tape.
The practical read-through is simple. When RSI stays high and the averages remain aligned, a pullback cannot be treated as a collapse by default. At the same time, a fresh long view loses quality if momentum never resets. Traders have to weigh both sides of that picture.
Intraday Pivot Reads and Volatility Context
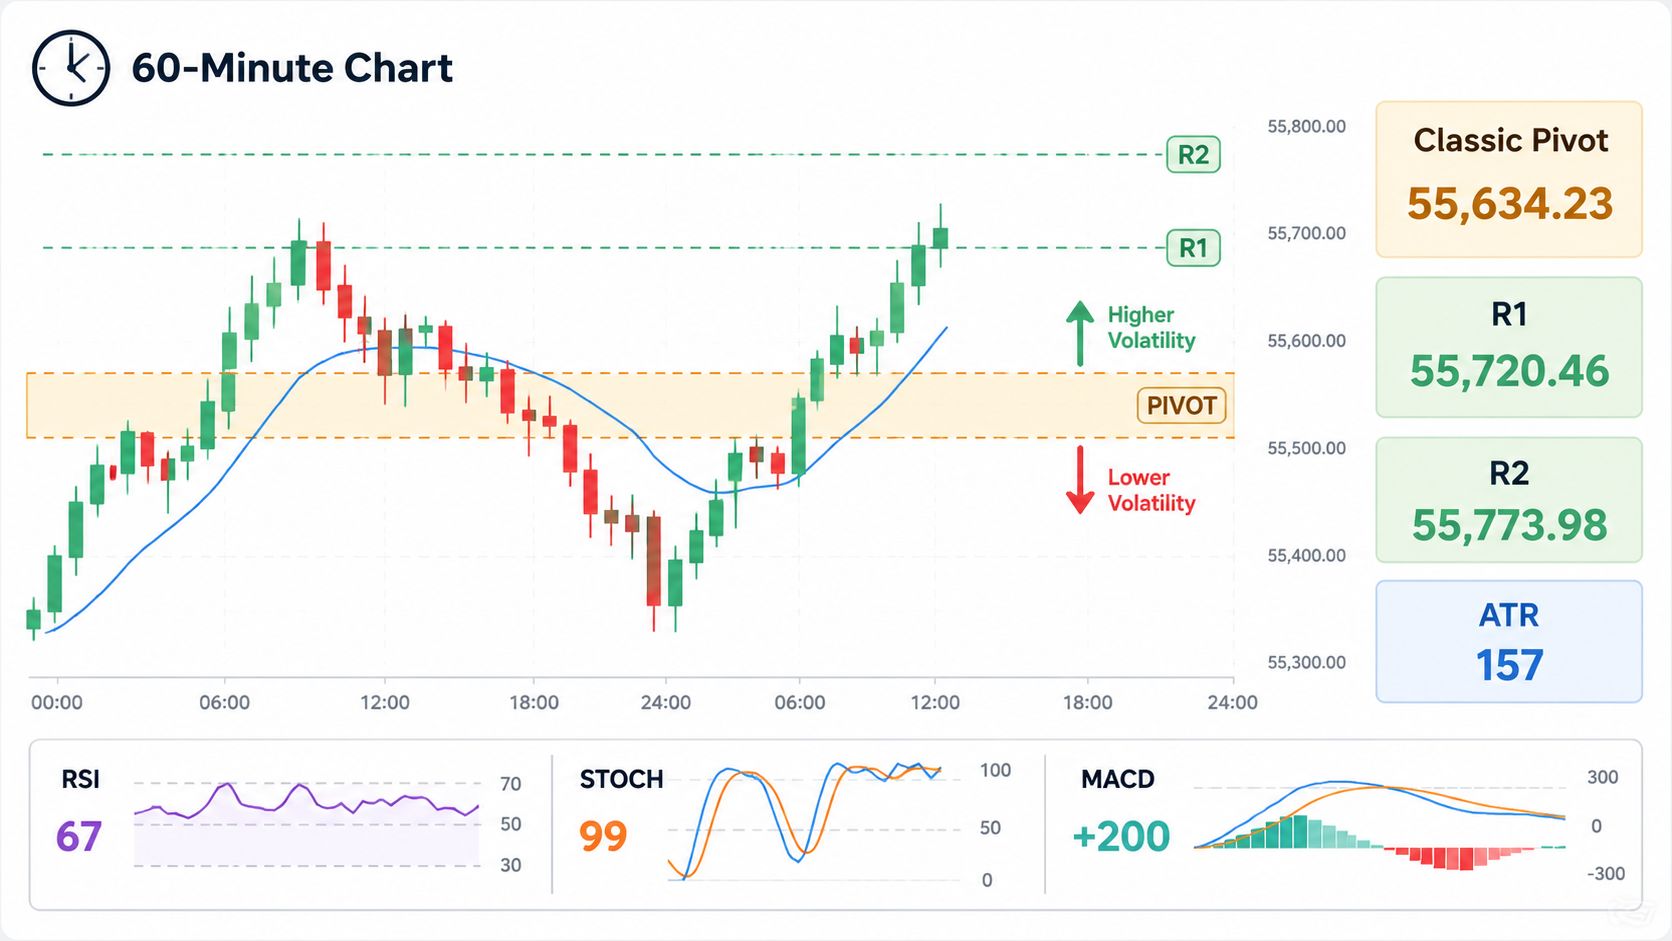
The intraday read can look different from the broader chart. On Investing.com India's 60-minute BANKNIFTY panel, RSI(14) was 67.306, STOCH(9,6) was 99.661, STOCHRSI(14) was 87.314, MACD(12,26) was +200.16, ADX(14) was 58.295, Classic pivot was 55,634.23, R1 was 55,720.46, R2 was 55,773.98, and ATR(14) was 157.053 Investing.com India BANKNIFTY 60-minute panel.
What the oscillators are really saying
The short-term oscillators are stretched. STOCH at 99.661 and STOCHRSI at 87.314 point to an overextended intraday tape, while RSI above 67 shows momentum has moved well ahead of a neutral reading.
That still does not force a reversal. The MACD is positive and the ADX at 58.295 shows the trend itself is unusually strong. Traders often misread that combination. Overextended can still sit inside a strong advance, but it also means the move has already travelled far and needs fresh participation to keep going.
Why pivots and ATR matter
The pivot band is the decision area. A market trading above the pivot but below resistance is usually being watched for acceptance above the first resistance or rejection near the next one. That is more useful than treating the numbers as magic lines.
The ATR(14) of 157.053 is the volatility yardstick here. In practice, that means a swing of roughly 150 points in a session is not unusual enough to be treated as random noise. It also explains why very tight mechanical stops can get clipped in Bank Nifty.
For readers comparing short-horizon setups with published trade language, this intraday trading calls page shows how that framing is often presented. The key question around the pivot band is whether volatility is compressing into a range or expanding into a clean directional move.
Why Bank Nifty Moves Can Mislead You
A headline that says Bank Nifty was down 0.42% can make the whole banking sector look weak, but that reading is often too blunt. A live snapshot on NiftyTrader Bank Nifty today showed Canara Bank +1.01% and Union Bank of India +0.75% positive, while IndusInd Bank -1.79% and Axis Bank -1.40% lagged, with PCR at 0.82 and India VIX at 11.86.
Concentration matters more than the headline
Bank Nifty is a weighted index, so a few large lenders can pull the print even when some constituents are green. A trader who reads only the index line can miss the actual drivers. In this snapshot, the index looked soft, but the stock-by-stock picture was mixed, not uniformly bearish.
Many “today” pieces stay too generic. They talk about support and resistance, but they skip the more useful question, which is which banks caused the move, and was it broad-based or concentrated?
What PCR and VIX can and cannot tell you
PCR 0.82 suggests a mildly bearish options setup, while India VIX 11.86 points to a relatively calm volatility backdrop. Neither number is a standalone signal. They are context tools, not commands.
Sentiment gauges help you frame the day. They don't replace price, range, and constituent-level reading.
That distinction matters because a low-volatility day can still produce sharp stock-specific swings inside the index. A trader who understands dispersion will read the leaders and laggards first, then decide whether the index move is meaningful or just a narrow print.
Catalysts, Attribution, and the SEBI Posture
Bank Nifty rarely moves for one reason alone. On a given day, the tape can react to RBI policy, credit growth, deposit pricing, US Treasury yields, FII and DII flows, or a single bank's quarterly numbers. Broad macro events usually influence the whole index, while a bank-specific result often shows up as dispersion across constituents rather than a clean one-way trend.
That split matters for how the move is read. A policy shift can alter sentiment across the sector, while a lender's margin or asset-quality update may change only part of the tape. The reader has to separate a broad market response from a stock-specific move, because the index line alone does not always show which force was stronger.
The compliance standard matters just as much. If a report quotes a target, a stop, or a directional call, it should be tied to a named SEBI-registered analyst, with the registration visible and the timestamp intact, or to a clearly cited public source such as the official exchange tracker. That is the line between accountable reporting and anonymous tip culture.
This material is for informational and educational purposes only. It is not investment advice, and readers should consult a SEBI-registered adviser before investing.
A reader can see the difference quickly. Reporting shows what moved, who moved it, and when it was published. Tip-style content tells you what to do without showing the work behind it.
Putting Together a Daily Bank Nifty Read
A usable Bank Nifty routine doesn't need a dozen indicators. It needs a sequence. First, snapshot the index price, range, volume, and any nearby moving average. Second, check whether higher-timeframe momentum is stretched or healthy. Third, read the 60-minute pivot and volatility picture. Fourth, identify which constituents pushed the index. Fifth, look at attributed market views only after the data is in place.
A simple desk routine
- Snapshot the index: start with price, change, range, volume, and the 200-DMA reference.
- Map the technicals: translate RSI, ADX, and moving averages into plain trend language.
- Read pivots and volatility: look at the 60-minute structure, the oscillator stretch, and the ATR backdrop.
- Track constituents and catalysts: separate broad sector moves from stock-specific dispersion.
- Attribute every call: rely only on named analysts with visible registration, timestamps, or public exchange pages.
That routine fits into a short pre-market or early-session review. It's a reading template, not a system, and it doesn't remove the need for your own position sizing, risk control, or decision-making.
The best habit is also the simplest one. Treat opportunity and risk together, not separately, and never confuse a strong trend with a safe one. A stretched chart can still keep running, but only if the tape keeps attracting participation.
Practical Questions About BankNifty Analysis Today
The most useful intraday reads usually matter most in the first hour and the last hour, when pivots get tested and order flow is most visible. Free public sources can refresh at different times, so timestamps matter more than most beginners realise. A quoted level without a time stamp is just a snapshot, not a live truth.
Overbought does not mean “about to fall”. Trend strong does not mean “safe to add”. And PCR and India VIX are sentiment gauges, not standalone signals, so they help you frame the session rather than predict the next candle.
Bharatstox reports, attributes, and timestamps market information, and it does not issue calls in its own voice. If you want to act on a view personally, the right next step is to compare the data with your own process and, if needed, speak with a SEBI-registered adviser.
Bharatstox tracks the market the way a trader would want it tracked, with named sources, live context, and plain-English explanations around Bank Nifty and other NSE movers. If you want more daily market reads like this, visit Bharatstox for attributed news, education, and data-led coverage before the next session opens.
Disclaimer
This article is for informational and educational purposes only and does not constitute investment advice or a recommendation. Investing in securities markets is subject to market risks. Read all related documents carefully before investing.