Costly Share in India: What It Really Means
Costly share in India explained — price per share vs market cap, the highest-priced names on NSE/BSE, and what retail investors should actually consider.
MRF is the best-known costly share in India, with a quoted price of about ₹1,32,010 in late August 2026. That does not mean it's the biggest company, because State Bank of India traded around ₹1,047.50 while being far larger in market size than a single high-priced share.
A costly share in India is a stock with a high quoted price per share on NSE or BSE, nothing more. The smarter question is not “which stock costs the most?”, but “what is this price telling me?”
Table of Contents
- What a Costly Share in India Actually Means
- Price per Share Versus Market Cap Versus Free Float
- The Highest-Priced Shares on NSE and BSE Right Now
- Why Stock Splits and Face Value Shape the Headline Price
- Liquidity, Lot Size and the Real Cost of Trading Them
- Price Alone Is Not Valuation
- Key Takeaways and the SEBI Compliance Reminder
What a Costly Share in India Actually Means
A costly share is a stock whose single-unit market price is high in rupees, with no built-in judgement about quality or size.
That simple definition helps because beginners often mix up three different ideas. The first is price per share, the number you see on the screen. The second is free float, the portion of shares that can trade in the market. The third is face value, the accounting value printed on the share, which is often much smaller than the market quote.
MRF is the familiar anchor here because it has long sat in the expensive-share discussion, with a quoted price around ₹1,32,010 and a 52-week high of ₹1,63,600 in the referenced market list, while its market capitalisation was about ₹56,054 crore (Ventura Securities). That is why the label costly share in India stays so narrow. Very few Indian stocks cross even the ₹50,000 level.
Practical rule: A high share price tells you how much one unit costs, not how large the business is.
The three questions to keep asking
- How much is one share priced at? That is the headline number on the screen.
- How many shares can trade? That is the free-float question.
- What is the face value and split history? That often explains why the quote looks unusually high.
A stock can have a very high quote because of its history, not because it dominates the economy. It can also be expensive because few shares are available to trade, which makes price discovery uneven. That's why the same screen price can describe a small, illiquid company or a large, well-known business.
Price per Share Versus Market Cap Versus Free Float
Start with the number on the screen. Price per share is what one share costs. Market capitalisation is the value of all shares together. Free float is the portion that trades in the market.
That is why a high quote can mislead. SBI can look inexpensive beside MRF, yet the business behind it is much larger in total value. A costly share in India often reflects the price of one unit, not the size of the company. For a clear primer on these basics, see share market basics in India.
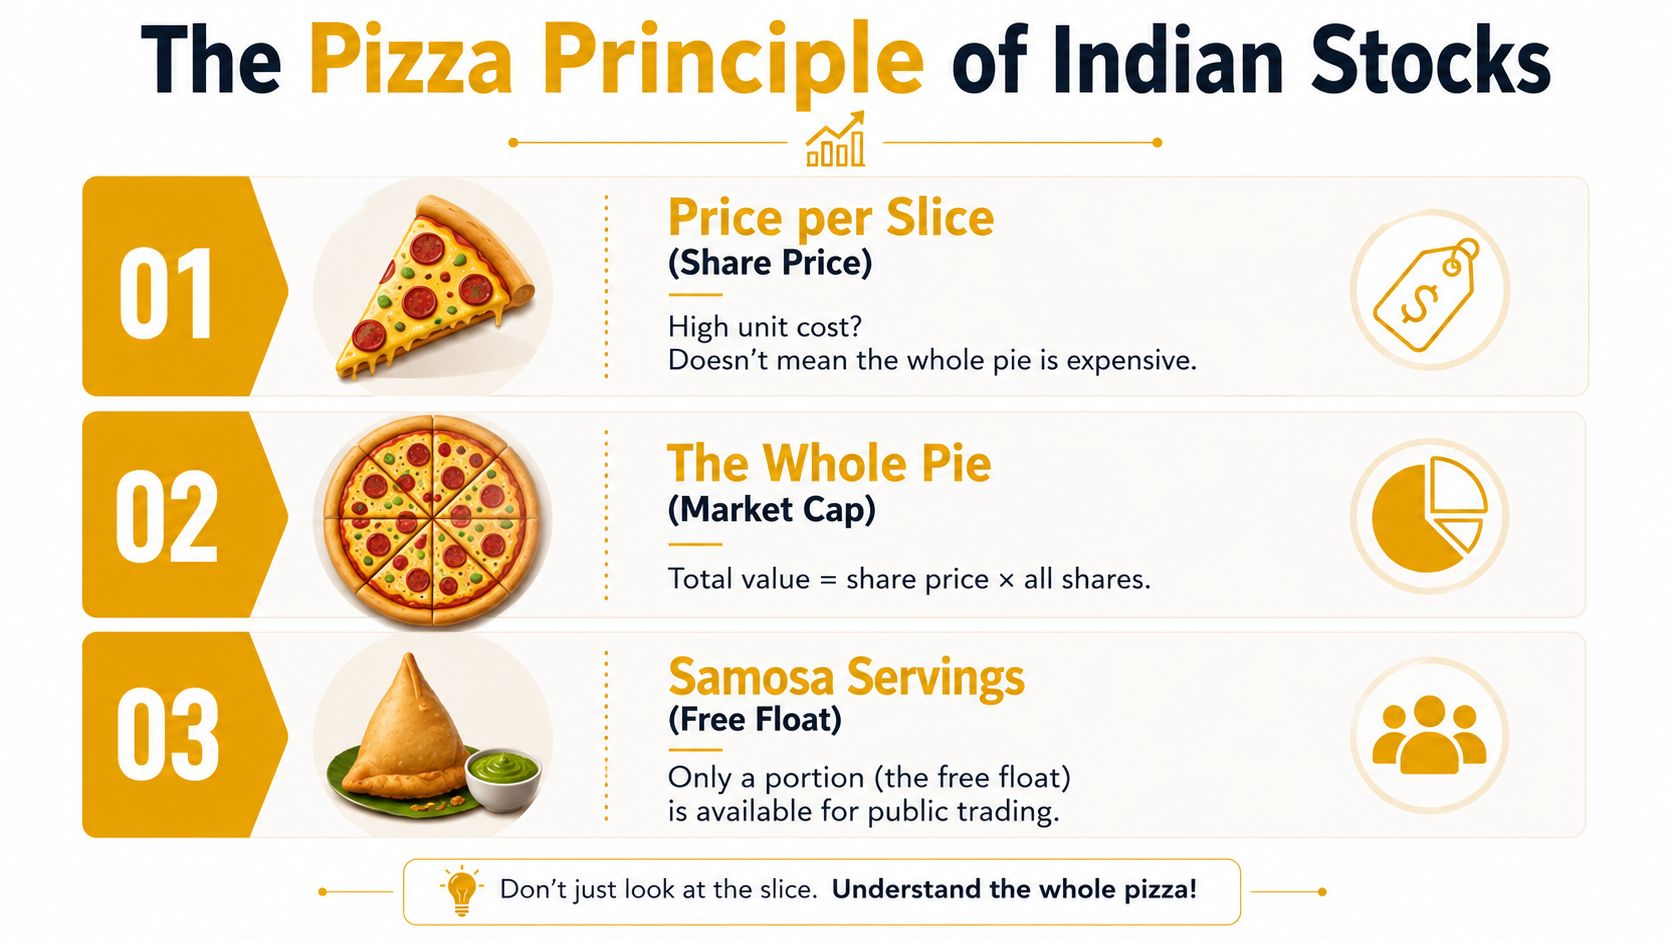
For beginners, the cleanest way to separate the terms is simple. Share price is the cost of one unit. Market cap is that price multiplied by the total shares outstanding. Free float is the part available to public investors after promoter holdings and other restricted shares are removed.
Free float changes the trading experience. Many Indian companies have concentrated ownership, so the tradable pool is smaller than the full share count suggests. That is one reason some expensive names also feel harder to buy and sell. The public is not trading against every shareholder, only against the shares available in the market.
A small example makes the difference easier to see. If a share price were ₹2 lakh and only 10,000 shares were effectively available, trading would feel very different from a ₹500 share with 1 crore free shares. The first case gives you less room to enter and exit smoothly. The second usually has deeper trading interest.
One useful shortcut helps here. High price, low free float, and small market cap can appear together, but they do not mean the same thing. Price answers a single-share question. Market cap answers a business-size question. Free float answers a trading-access question.
That is the core mistake many readers make with the label costly share in India. A stock can carry a big headline price because of its share structure and trading pool, while another stock with a lower quote can represent a much larger company.
The Highest-Priced Shares on NSE and BSE Right Now
The price board can be misleading. A share with a very high quote is not automatically a larger business, and it is not always the easiest one to trade. MRF, Elcid Investments, and Page Industries show that the headline number needs context.
A side-by-side view helps. It shows why the same “costly share” label can hide very different realities.
| Company | Approx. Price (₹) | Market Cap (₹ Cr) | Free Float (%) | Sector | Note |
|---|---|---|---|---|---|
| MRF | 1,32,010 | 56,054 | Not clearly specified in the cited list | Tyres | Long split history and strong brand-led earnings power support a very high quote (Ventura Securities) |
| Elcid Investments | 1,24,101 | 2,482 | Not clearly specified in the cited list | Investment holding | Very high quoted price linked to low float and rare price discovery, as noted in our market-basics explainer |
| Page Industries | Around 40,000 | Not specified in the cited list | Not clearly specified in the cited list | Consumer / apparel | Regularly appears in expensive-share rankings, with a very different business profile from MRF |
| SBI | Around 1,047.50 | Not specified in the cited list | Not specified in the cited list | Banking | Large-cap contrast, lower quote does not mean small company (Finology) |
The table is only a snapshot. Prices move through the day, so a live screen is better than a static list if you want to compare current quotes. For that, the NSE and BSE live market page is useful because it places the quote next to the broader market view.
The main lesson is simple. A high share price can come from limited free float, long-running corporate actions, or a different ownership pattern. It does not, by itself, tell you how big the company is or how easy the share will be to buy and sell.
Why Stock Splits and Face Value Shape the Headline Price
A share's face value is just the accounting label attached to it. It is not the same thing as market price. In India, listed equity commonly carries a ₹1 or ₹10 face value, while the market can price the same share at a much higher number depending on demand, liquidity, and history (Finology).
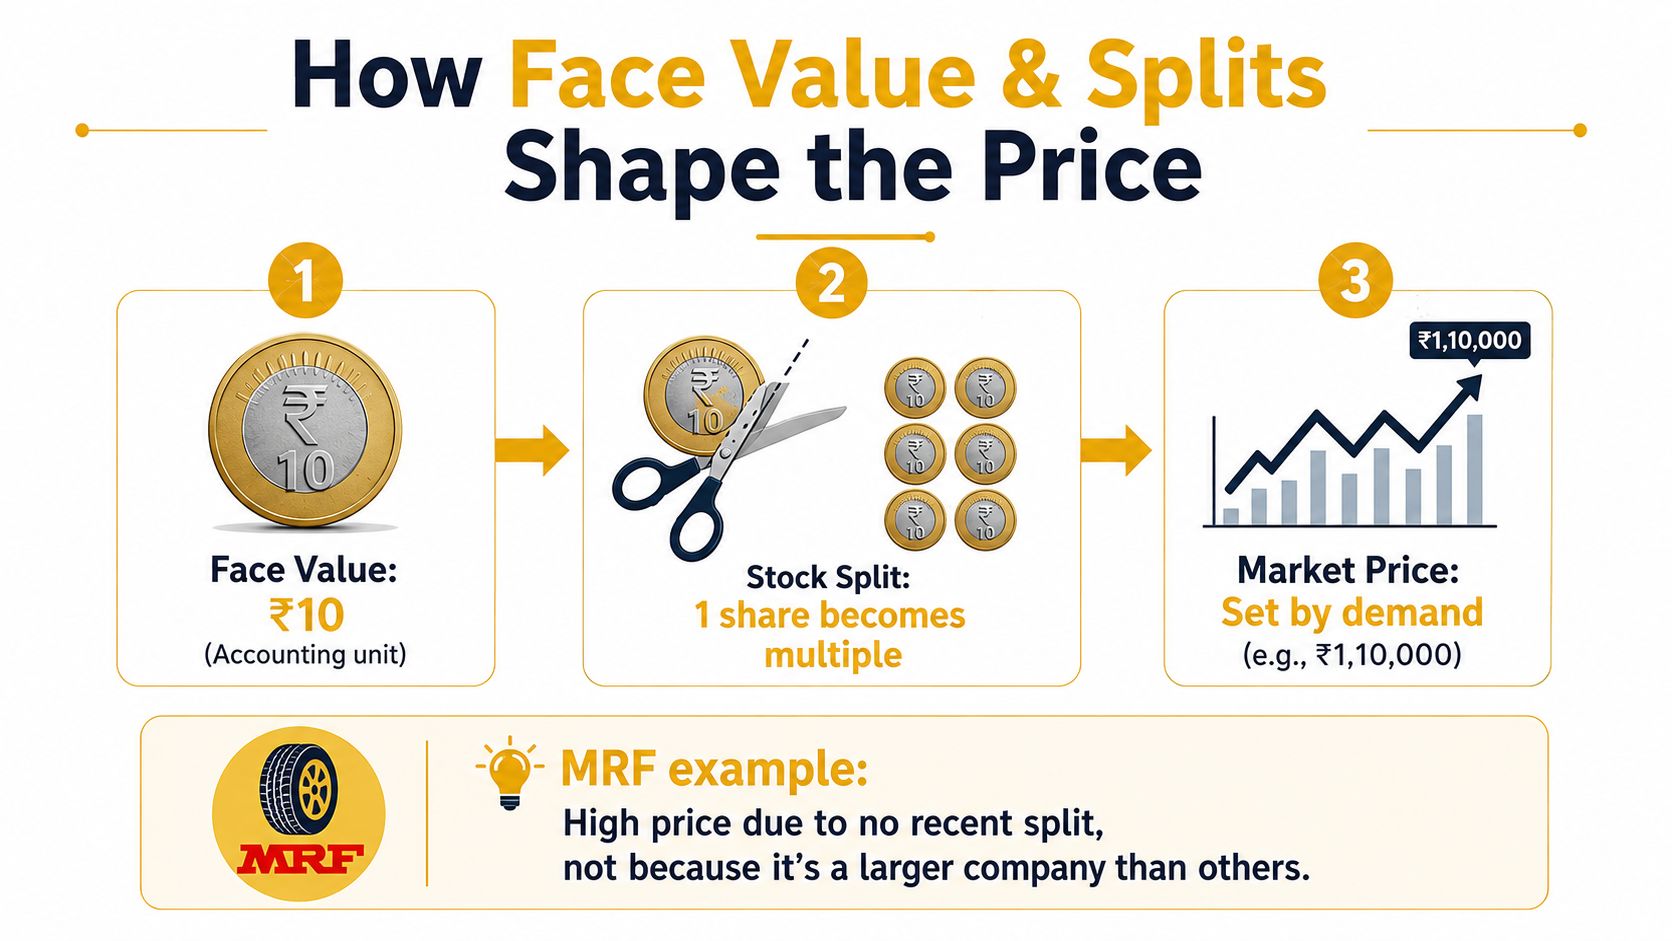
A stock split changes the packaging, not the business. If a share priced at ₹1,30,000 is split 1:10, one share becomes ten shares, each worth about ₹13,000 in simple arithmetic. The company's market cap stays the same at the moment of the split, and the investor's ownership percentage also stays the same. Only the number of shares changes.
The market price is set by demand and supply. The split only changes how the quote is displayed.
This is why MRF often comes up in discussions of costly shares. Its expensive quote is tied to a long history of limited splits, which kept the per-share number high even as the business grew. The quoted price is therefore a packaging choice, not proof that the company is larger than others.
Stock splits are only one corporate action. Bonus shares increase the number of shares, consolidations reduce them, and dividend reinvestment can also change the shape of the holding over time. The direction changes, but the logic stays the same. You are looking at how ownership gets divided, not whether the company became more valuable overnight.
For a plain-English overview of such events, Bharatstox's corporate action events guide is a useful companion read.
Liquidity, Lot Size and the Real Cost of Trading Them
The sticker price is only part of the trading cost. What matters just as much is how easily you can enter and exit. In cash markets, many expensive stocks trade in single shares, so buying one costly share and buying one cheaper share both sit inside the same brokerage framework. In derivatives, the cost picture changes because you deal in lots, not single shares.
A lot is the minimum contract size in futures and options. NSE lot sizes change over time, and in 2026 the index derivative lots were resized, with Nifty 50 reduced from 75 to 65, Bank Nifty from 35 to 30, and Sensex remaining at 20 (Sahi). That matters because contract value is the underlying price multiplied by the lot size. A high-priced underlying can become a very large notional trade very quickly.
| Stock | Approx. Price (₹) | Cash Market Minimum Buy | F&O Lot Size | Approx. Contract Value (₹) | Avg. Daily Volume |
|---|---|---|---|---|---|
| MRF | 1,32,010 | 1 share | Not specified in the verified data | Depends on contract design | Not specified in the verified data |
| SBI | Around 1,047.50 | 1 share | Not specified in the verified data | Depends on contract design | Not specified in the verified data |
access cost is often hidden in liquidity. Thinly traded expensive shares can have wider bid-ask spreads, which means you may pay more to get in and receive less when you exit. They can also create impact cost, where your own order moves the price slightly against you.
For small-screen trading, the safest habit is to check the contract note, not just the quote on the watchlist. A high-priced share is not automatically unaffordable. Sometimes the actual trading friction comes from low volume, not the headline rupee number.
Price Alone Is Not Valuation
A high quote does not mean a stock is expensive in the valuation sense. It just means one unit costs more. To judge valuation, investors usually look at P/E and P/B first, then at broader measures such as EV/EBITDA when they need a fuller view of the business.
P/E, or price-to-earnings, asks how much the market is paying for one rupee of earnings. P/B, or price-to-book, compares the share price with the book value on the balance sheet. EV/EBITDA looks at enterprise value relative to operating cash earnings before interest, tax, depreciation, and amortisation. Those are valuation tools. Share price is not.
This is why a costly share can trade at a very different multiple from a lower-priced large-cap. The useful question is not whether a stock shows five digits or four digits on the screen. The useful question is whether the market is paying a fair price for the company's earnings power, assets, and tradable supply.
Valuation rule of thumb: A share price without a multiple is just a number on a screen.
Free-float market cap and turnover ratios also matter because they tell you how much of the company is available to trade. A company with a concentrated promoter holding can feel very different from one with a deeper institutional float, even if the share price looks similar. That is one reason the same price tag can produce very different trading behaviour.
Bharatstox's own market-data tools can help readers compare price, market cap, and valuation fields in one place, but the interpretation still has to be done with care. The core lesson stays the same. Price is only the label. Valuation is the full story.
Key Takeaways and the SEBI Compliance Reminder
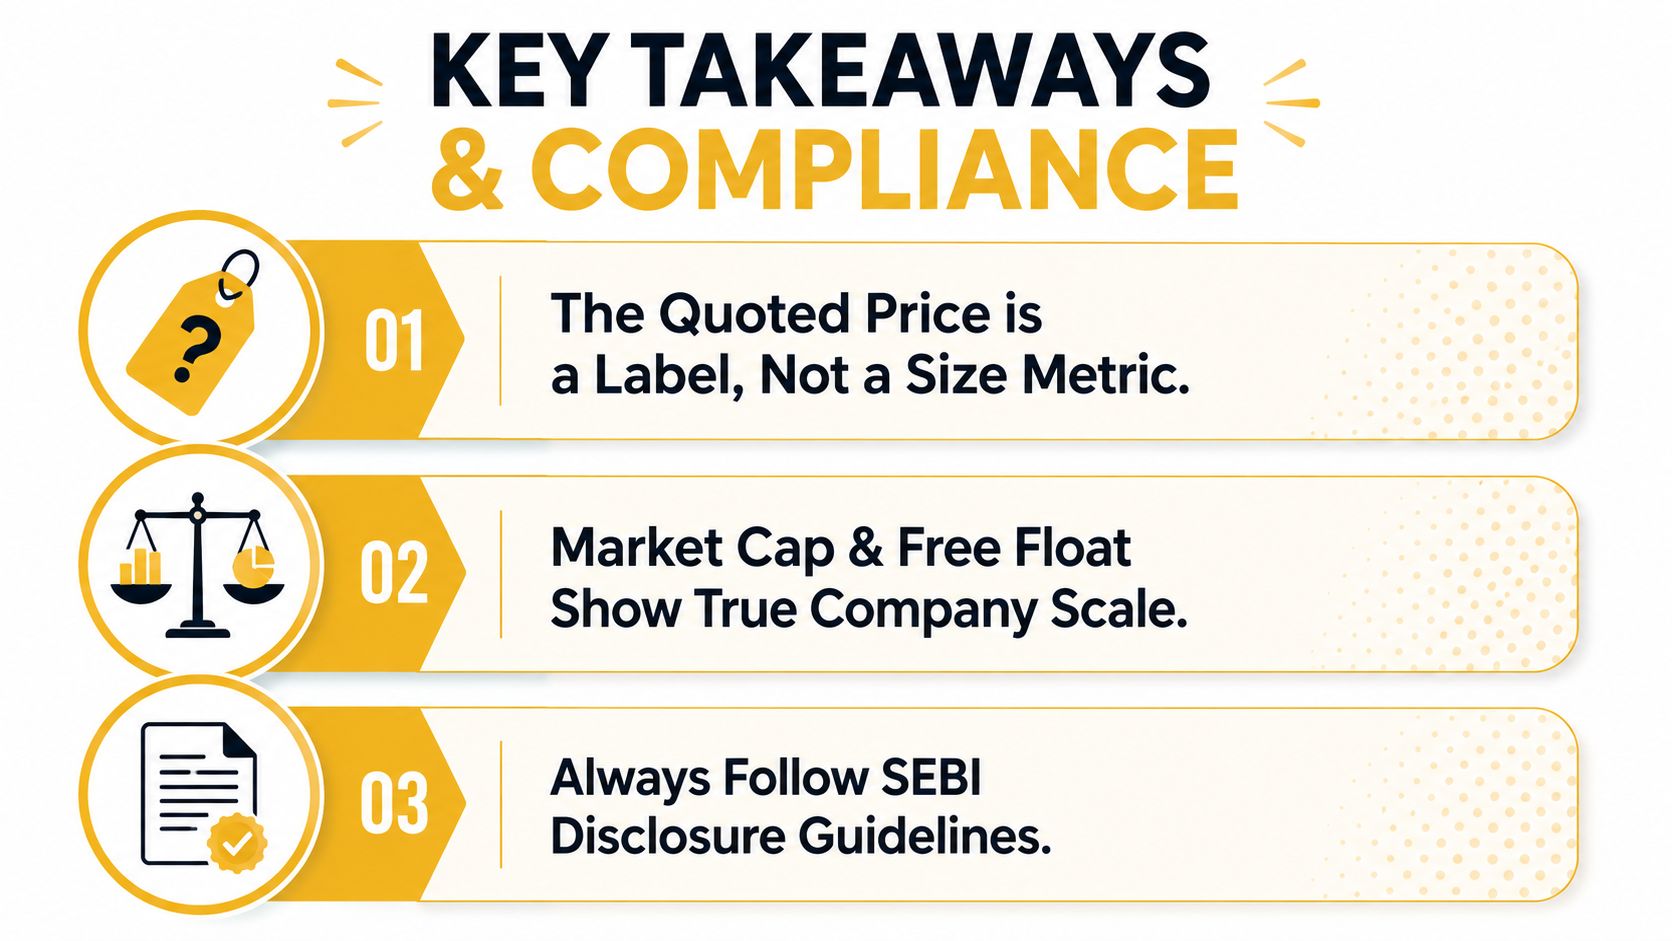
Three checks keep this topic clear. Quoted price is only the screen price. Market cap and free float show the business scale and how much stock is available to trade. Face value and stock splits can change the per-share look without changing your ownership share.
A high quote can still mean a small or tightly held company. A lower quote can belong to a much larger business. That is why the headline number needs context.
Before you buy any expensive-looking NSE or BSE stock, pause and run through a simple checklist.
- Check the market cap: It tells you whether the company is small, mid-sized, or large.
- Scan turnover and spread: These show whether entering and exiting may be smooth or difficult.
- Look at P/E and P/B: These help you judge valuation instead of staring at the quote alone.
- Note the face value: It often explains why the share looks unusually expensive.
- Check lot size if you trade derivatives: Contract size changes the exposure.
- Ask whether earnings are consistent: A high quote with weak business quality still deserves caution.
SEBI's Research Analysts Regulations, 2014 say no person may act as a research analyst, research entity, or hold themselves out as one without SEBI registration. The regulations were notified on 01 Sep 2014 and came into effect on 01 Dec 2014 (SEBI regulations). SEBI's investor education page says a person must obtain a SEBI Registration Number and hold the NISM-Series-XV Research Analyst Certification before offering research services (SEBI investor education). For the registration path and fee structure, SEBI's 2025 FAQ explains the Form A process and lists the registration and renewal fees (SEBI FAQ).
Consult a SEBI-registered adviser before investing, and see our guide on SEBI-registered research analysts if you want a clearer view of how research services are set up.
This is for informational and educational purposes only, not investment advice.
Disclaimer
This article is for informational and educational purposes only and does not constitute investment advice or a recommendation. Investing in securities markets is subject to market risks. Read all related documents carefully before investing.