Stock Market Analysis India: A Practical Guide
Discover stock market analysis India tips for retail investors. Learn key strategies to navigate markets in 2026 and make informed decisions.

India's equity market reached about ₹479 lakh crore, or US$5.3 trillion, in January 2026, ranking fourth globally after the US, China including Hong Kong, and Japan, according to the NSE Market Pulse January 2026 report. That scale shows the market's breadth, not a guaranteed return. Stock market analysis in India matters because participation has grown faster than financial capability. A disciplined process helps investors assess businesses, prices, and risk instead of following tips or reacting impulsively.
Table of Contents
- Why Stock Market Analysis Matters More Than Ever in India
- Fundamental Analysis for Indian Equities
- Technical Analysis in NSE and BSE Markets
- Macro Factors That Drive Indian Stock Movements
- Data Sources and Tools for Retail Investors
- Evaluating Research Quality and Avoiding Tip Culture
- Building Your Stock Analysis Workflow
Why Stock Market Analysis Matters More Than Ever in India
India's market is too broad to understand from one index move or a social-media opinion. NSE data recorded market capitalisation of ₹4,79,02,766.52 crore on 2 January 2026, while the broader Indian equity market grew at an annualised 15.5% over the last two decades, as documented in the NSE Market Pulse report referenced above. These figures show market scale and long-term structural growth, not a guaranteed return for an individual investor.
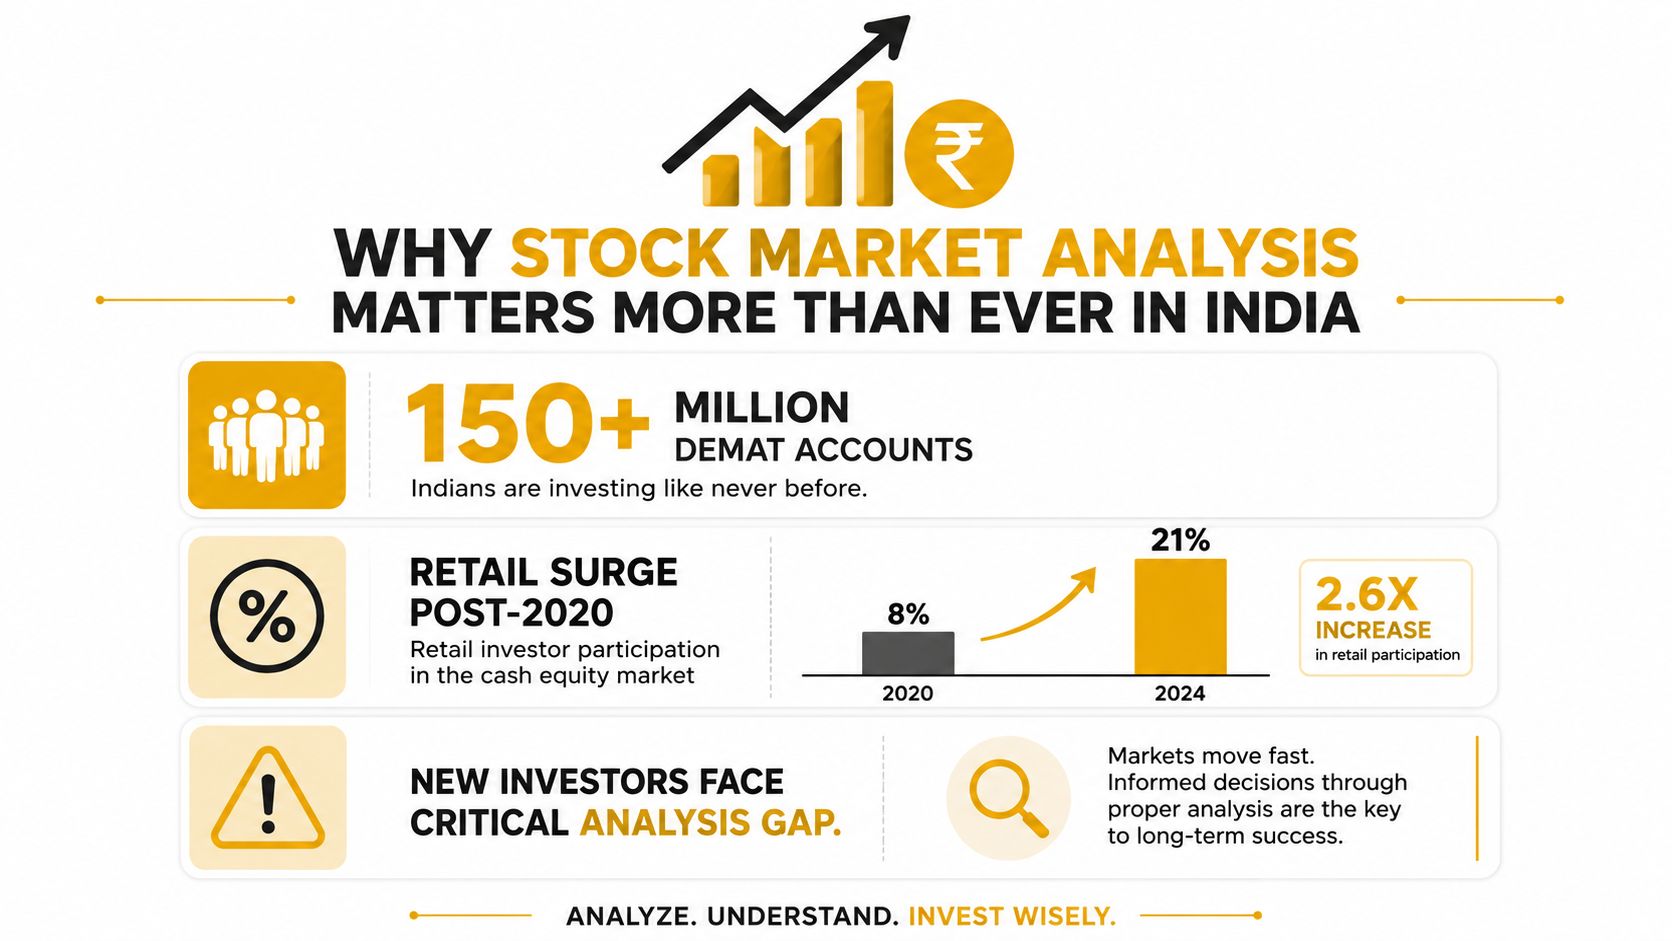
Retail access has widened sharply. A senior SEBI official said demat accounts rose from 3.6 crore in 2019 to 19.4 crore in 2025, a more than fivefold increase in six years. SEBI-linked reporting also placed unique investors at around 13.6 crore in 2025. Demat accounts do not equal individual people because one person can hold multiple accounts, yet the direction is clear. Millions of newer participants now affect cash equities, derivatives, and momentum-driven trading.
Participation is not the same as preparedness
A larger investor base does not automatically mean a better-informed one. NSE's Market Pulse reports that only 27% of Indian adults are financially literate, with meaningful regional and gender differences. It also records 1.4 crore investors added in 2025, while women made up about 25% of the investor base, as reported in the PIB press release cited earlier.
Access to live prices can arrive before the ability to read a balance sheet, assess valuation, interpret liquidity, or distinguish reporting from promotion. Analysis supplies a checklist: examine earnings, understand sector conditions, study price behaviour, and define the downside. A forwarded call removes that work while hiding its source, assumptions, and risks.
Core principle: More accounts can increase participation, but structured analysis improves decision quality.
India's exchanges are automated, demutualised, and order-driven, according to a comparative study of the Bombay and National exchanges. Prices emerge from orders, liquidity, and available information. A broad index rise or fall may reflect sector rotation, foreign flows, domestic institutional activity, or large-cap earnings rather than news about one company.
For daily context, readers can consult Indian stock market news from Bharatstox. News can provide the starting point for a question, while analysis tests whether the development changes a company's earnings, valuation, or risk. This content is for informational and educational purposes only, not investment advice. Consult a SEBI-registered adviser before investing.
Fundamental Analysis for Indian Equities
Fundamental analysis asks what a business owns, earns, owes, and may reasonably be worth. For an NSE or BSE-listed company, that means reading financial statements alongside management commentary, competitive position, promoter disclosures, and industry conditions. The objective isn't to find a magical ratio. It's to build and test a coherent explanation for how the company creates cash and what could weaken that ability.
Start with primary documents. Annual reports, quarterly results, investor presentations, shareholding filings, and corporate announcements are available through exchange websites and company investor-relations pages. Read revenue, operating profit, finance costs, profit after tax, operating cash flow, and changes in working capital together. Revenue growth without cash generation may deserve closer examination, while an apparently weak quarter may reflect a temporary cost, seasonality, or an investment phase.
Ratios need context
A price-to-earnings ratio, or P/E, compares a share price with earnings per share. Return on equity, or ROE, shows how efficiently a company uses shareholder capital to generate profit. Debt-to-equity indicates balance-sheet debt levels, and free cash flow represents cash left after operating needs and capital expenditure. None of these metrics works in isolation. A high ROE can result from heavy borrowing, and a low P/E can reflect deteriorating earnings rather than a bargain.
| Metric | What It Measures | India-Specific Consideration |
|---|---|---|
| P/E | Market valuation relative to earnings | Compare companies within the same sector and account for cyclical profits |
| ROE | Profit generated on shareholders' equity | Check whether leverage or one-off gains inflate the ratio |
| Debt-to-equity | Borrowing relative to equity | Consider interest costs, refinancing needs, and the business cycle |
| Free cash flow | Cash remaining after operating and capital expenditure | Reconcile reported profit with cash conversion and expansion spending |
| Promoter holding | Promoters' ownership stake | Review changes, pledging, and disclosures in exchange filings |
| Operating margin | Profitability of core operations | Test whether pricing power can withstand input-cost pressure |
Indian investors also need to examine promoter shareholding, pledged shares, related-party transactions, auditor observations, and corporate-governance disclosures. These details can change the quality of an otherwise attractive numerical profile. A business with rising earnings may still carry governance or capital-allocation risks that a simple screen won't reveal.
Use sector-specific lenses
Banks require different questions from consumer companies. For a bank, examine net interest margin, asset quality, provisioning, capital adequacy, and deposit growth. For a retailer, same-store sales growth, store productivity, inventory turnover, and lease obligations may be more informative. Infrastructure companies need scrutiny of order books, execution, receivables, working capital, and project funding.
Valuation methods should match the business. A discounted cash flow model estimates present value from expected future cash flows and assumptions about growth, margins, capital expenditure, and discount rates. Comparable-company analysis compares valuation multiples with similar businesses. Both are sensitive to assumptions, so treat the output as a range of possibilities rather than a precise truth.
Technical Analysis in NSE and BSE Markets
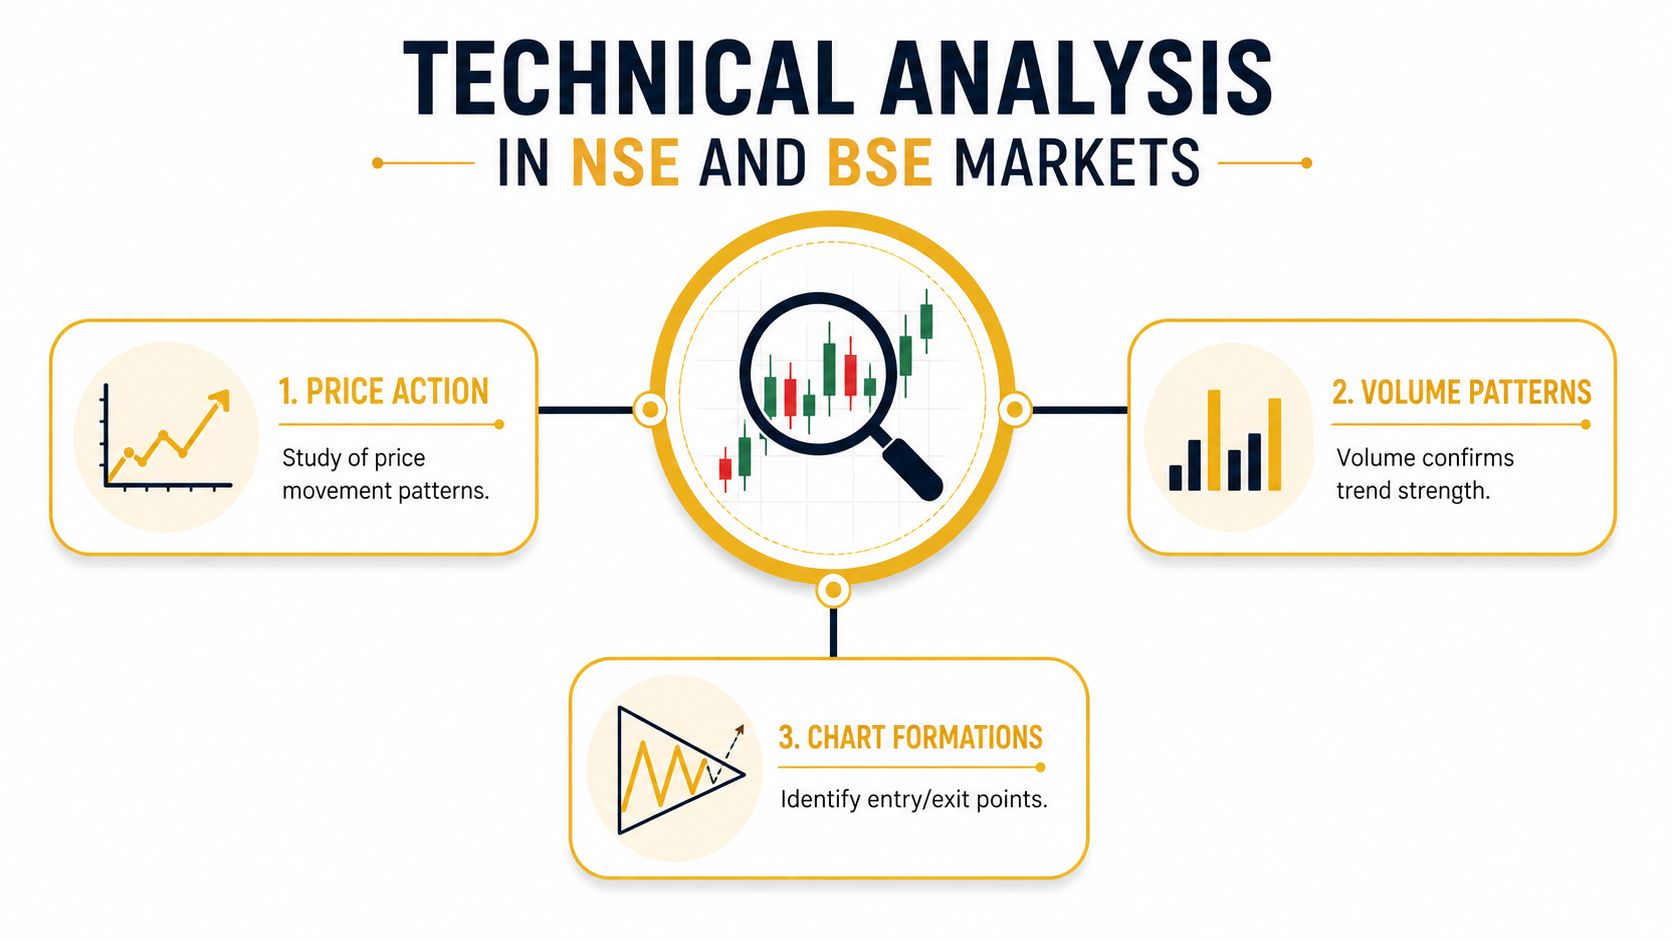
Technical analysis studies price, volume, and market behaviour rather than a company's intrinsic value. It can help an investor describe whether a security is trending, consolidating, breaking out, or losing momentum. It can't explain every move, and it shouldn't be used as a substitute for understanding liquidity and risk.
A basic chart-reading process begins with price action, which means observing how buyers and sellers have behaved. Support is an area where demand has previously appeared, while resistance is an area where selling has previously emerged. These aren't guaranteed floors or ceilings. A level can fail when new information, unusual order flow, or broad market pressure changes the balance.
Read indicators as evidence, not verdicts
Moving averages smooth price data and can help identify trend direction. The relative strength index, or RSI, measures the speed and magnitude of recent price changes. MACD, or moving average convergence divergence, compares moving averages to indicate momentum shifts. These tools describe historical behaviour. They don't know whether the next result will beat expectations or whether an unexpected policy announcement is coming.
Common formations include double tops, double bottoms, head-and-shoulders patterns, triangles, and cup-and-handle structures. A gap around an earnings announcement or RBI policy event may signal a sharp repricing of expectations. The pattern becomes more meaningful when the accompanying volume supports the interpretation.
NSE research has reported a median limit-order-book spread of ₹0.45, as discussed in an NSE research paper on Indian market microstructure. The same source material notes that retail algorithmic trading tightened Nifty 50 spreads by 0.42 basis points after 2020, while small-cap volatility increased by 14.7% in the cited academic work. These figures illustrate why a liquid index constituent and a thinly traded small-cap counter shouldn't be analysed or traded as though they behave identically.
Practical rule: A breakout without convincing volume deserves more scepticism than a breakout supported by broad participation and sustained liquidity.
Match the chart to the decision horizon
Intraday traders may use shorter charts to study execution and immediate order flow. Positional investors may find daily or weekly charts more useful because they reduce the noise of individual transactions. A long-term investor can use monthly structure to understand the broader trend, while still relying primarily on business fundamentals.
The NSE and BSE live market view from Bharatstox can help readers observe price action, volume, pivots, and volatility in an Indian-market setting. Use such tools to form questions, not automatic instructions. A chart can show where a price has been. It can't remove the possibility of slippage, gaps, or an incorrect interpretation.
Macro Factors That Drive Indian Stock Movements
Company-specific analysis becomes more useful when placed inside the wider economic environment. Top-down analysis begins with rates, growth, policy, currency, and commodities, then narrows towards sectors and companies. Bottom-up analysis begins with a business and evaluates its financial strength. Indian investors get a more complete picture when both approaches point to the same question, rather than treating either one as sufficient.
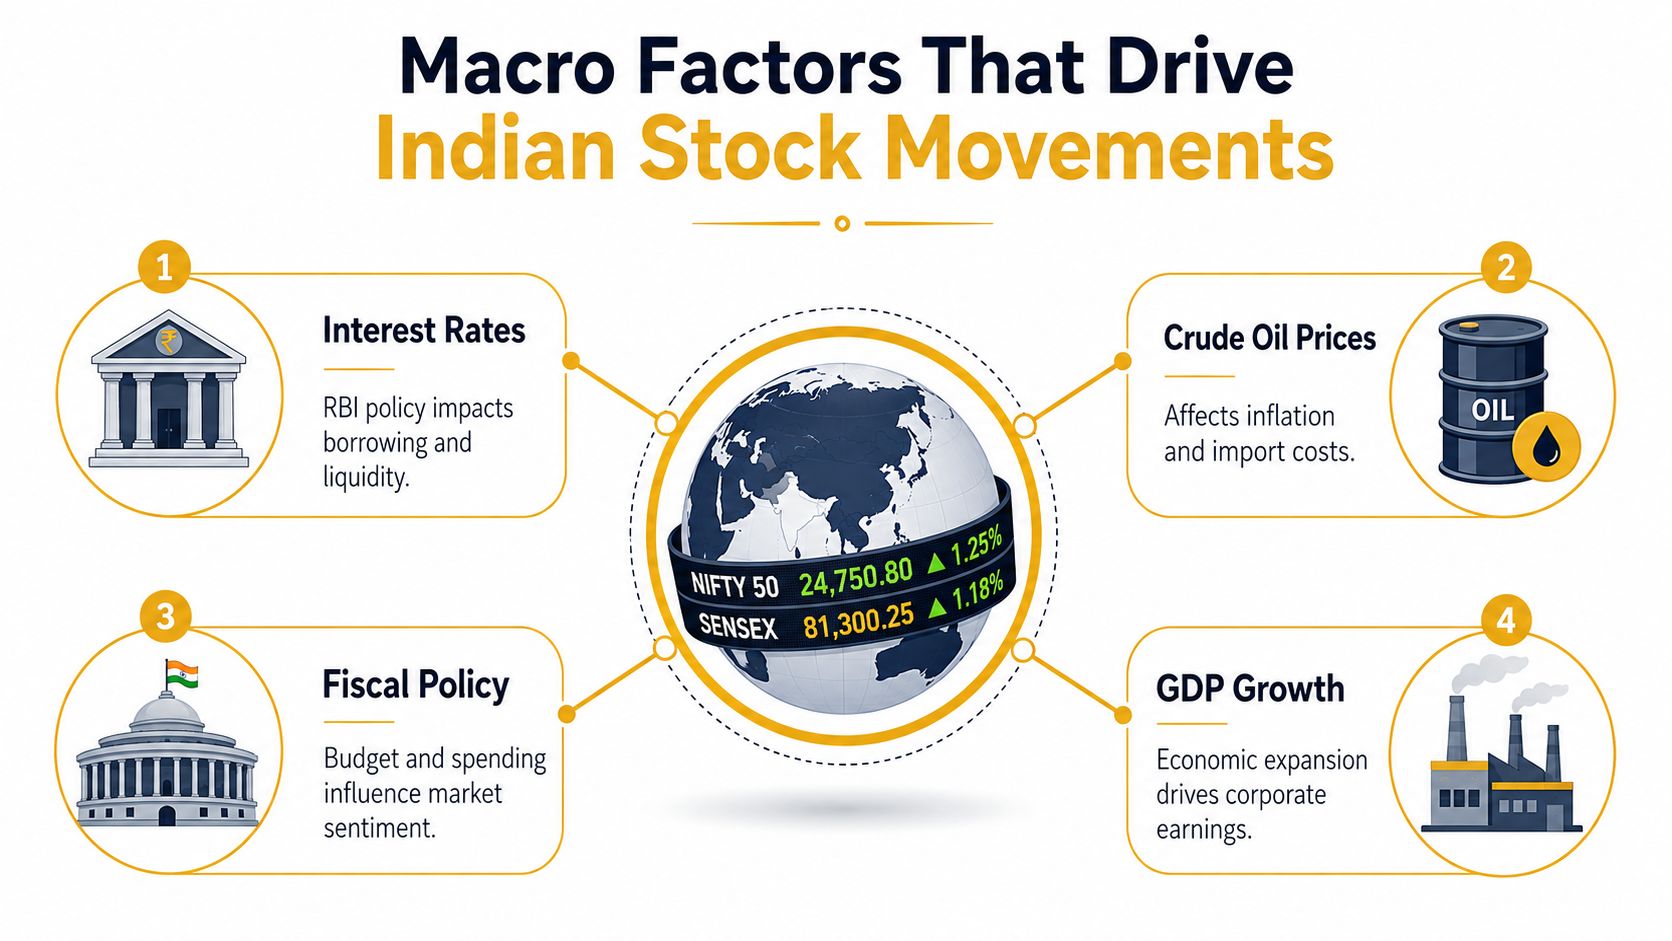
RBI policy is a central transmission mechanism. A change in borrowing costs can affect banks' lending economics, housing demand, automobile financing, and real-estate activity. The effect isn't uniform. A lender may benefit from one part of a rate cycle while facing pressure elsewhere through deposits, credit quality, or competition.
Follow the transmission chain
Foreign institutional flows can influence liquidity and volatility, especially in large-cap indices. Domestic institutional participation may offset or amplify that movement. Rather than treating daily flow data as a standalone signal, ask which sectors are being bought or sold and whether earnings expectations support the price response.
Fiscal policy can redirect attention towards infrastructure, manufacturing, defence, transport, or other areas affected by government spending and policy incentives. The Union Budget and production-linked incentives may influence sector expectations, but an announced policy isn't the same as delivered earnings. Investors still need to examine execution, order conversion, margins, and cash collection.
Monsoon conditions can affect rural income and demand for consumer goods, agricultural inputs, and tractors. That relationship is indirect and varies with prices, regional distribution, and household finances. It's more useful to treat monsoon news as an input into a demand hypothesis than as an automatic sector call.
Add global variables to the checklist
US Federal Reserve decisions can influence global risk appetite and currency movements. Crude oil prices affect India's import bill, inflation expectations, transport costs, and the profitability of businesses exposed to energy prices. Changes in USD/INR can alter reported revenue and margins for IT services exporters, while import-heavy businesses may face a different effect.
A macro-aware analyst records the likely direction of each factor, then tests whether the company's financial statements confirm the expected impact. That simple discipline prevents a popular macro narrative from overpowering company-level evidence.
Data Sources and Tools for Retail Investors
Reliable analysis starts with reliable documents. A price chart or financial ratio can be useful, but the analyst should know where the figure came from, when it was updated, and whether the company has restated or reclassified the underlying information. Primary filings deserve priority over screenshots and forwarded summaries.
Build a source hierarchy
NSE and BSE corporate announcements are the starting point for results, board decisions, shareholding information, and material disclosures. SEBI's investor resources explain regulatory expectations, while the MCA system can help users inspect company-related filings. RBI databases support macroeconomic research. Paid databases such as CMIE Prowess can provide deeper financial history, subject to their access terms.
Free platforms can speed up screening, but users should verify important figures against filings. Screener.in and Tijori Finance can help compare financial ratios and business histories. TradingView and Chartink support chart-based work. Moneycontrol and The Economic Times can assist with news discovery, though the original filing or official release remains the stronger reference for a material event.
| Source/Tool | Primary Use | Cost | Best For |
|---|---|---|---|
| NSE and BSE filings | Corporate announcements and disclosures | Public access for many documents | Primary verification |
| SEBI investor resources | Regulatory and investor-protection information | Public access | Compliance awareness |
| RBI database | Rates and economic indicators | Public access | Macro context |
| Screener.in | Fundamental screening | Free features and paid options may vary | Initial company comparison |
| Tijori Finance | Company and sector research | Access terms vary | Sector context |
| TradingView | Charts and technical studies | Free features and paid options may vary | Chart analysis |
| Chartink | Technical scans | Free features and paid options may vary | Rule-based screening |
| CMIE Prowess | Detailed financial data | Subscription-based access | Deeper institutional research |
Investors comparing platforms can also review this guide to find stock analysis software, especially when deciding whether screening, charting, filing search, or portfolio tracking is the main need. The right tool is the one that reduces avoidable errors without encouraging users to treat a screen as a final decision.
Bharatstox publishes market journalism, live NSE and BSE panels, corporate-filing updates, and a stock screener with metrics such as P/E, ROE, dividend yield, market capitalisation, and returns. Its equity research platform guide can help readers compare research workflows, but every displayed metric still requires interpretation and source checking.
Evaluating Research Quality and Avoiding Tip Culture
India's retail participation has expanded faster than financial literacy. As reported in the PIB press release cited earlier, only 27% of Indian adults are financially literate. The gap matters because a stock tip can spread widely before readers have checked its assumptions, evidence, or risks.
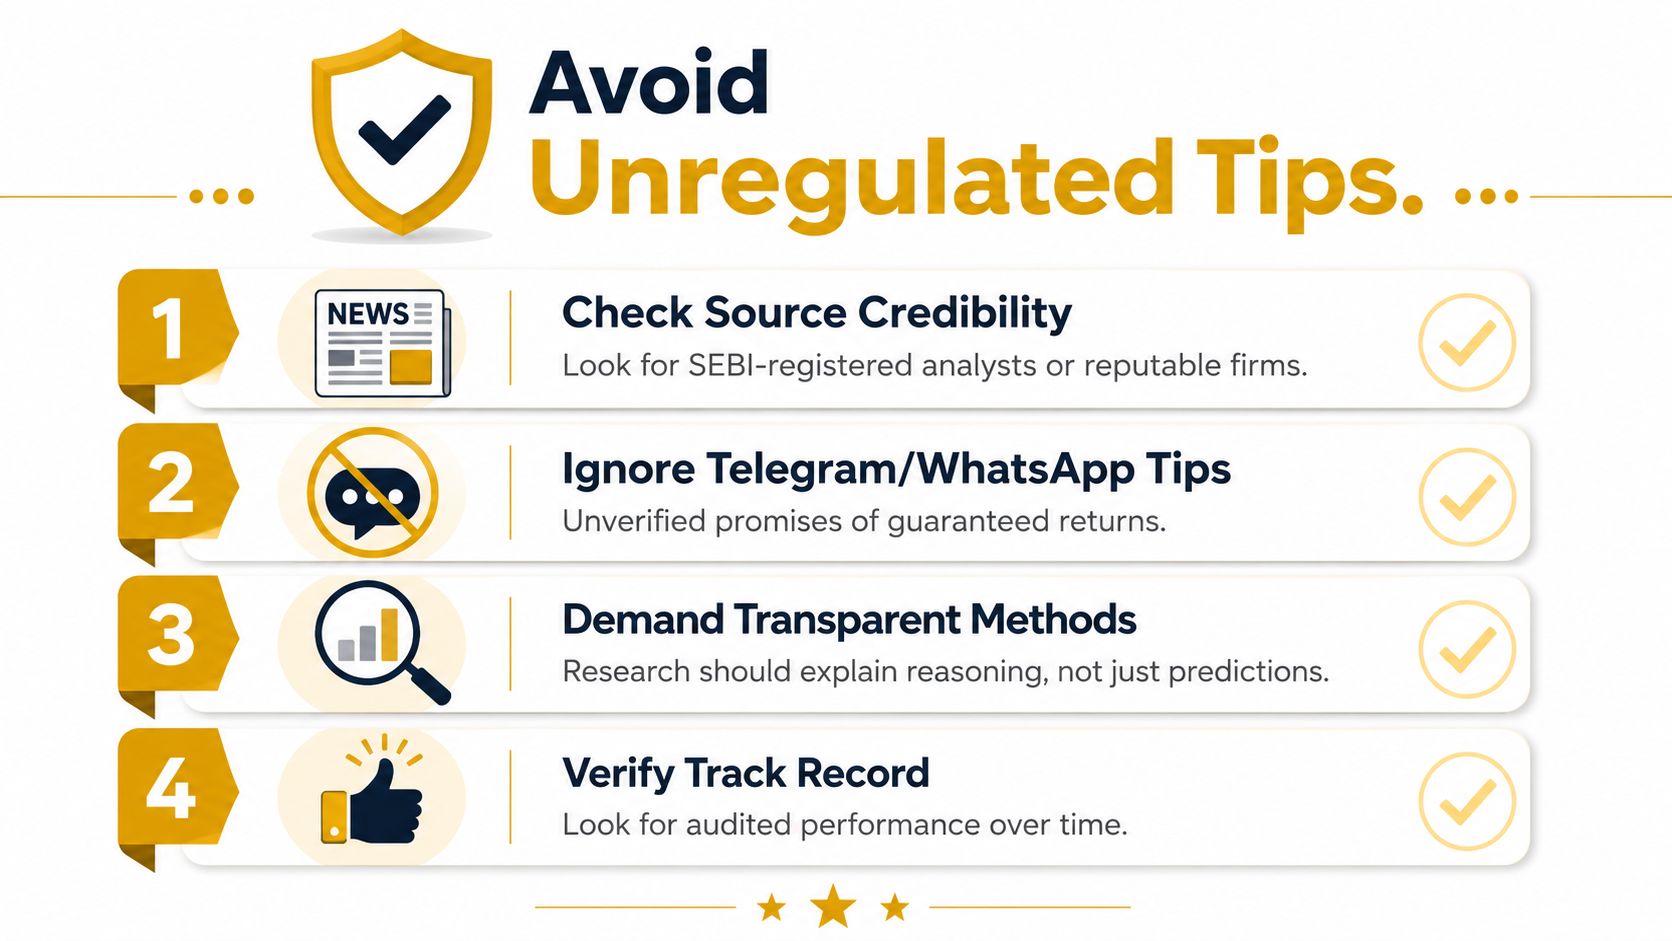
A confident message is not proof of sound research. Telegram posts, WhatsApp forwards, and videos may provide a stock name and target price while omitting the valuation method, time horizon, conflicts, liquidity concerns, and conditions that would weaken the thesis. Treat a tip as a starting question, not an analysis.
A quality check for published research
SEBI's Research Analysts Regulations, notified on 01 Sep 2014 and effective from 01 Dec 2014, address registration, certification, disclosures, conflicts, records, and inspection procedures, as set out in the SEBI Research Analysts Regulations document. SEBI guidance also requires a research analyst to obtain a registration number before offering research services and to include prescribed disclosures in research reports.
Use this checklist before relying on a report:
- Registration: Check whether the person or entity is registered with SEBI for the service offered.
- Method: Look for reasoning about earnings, valuation, catalysts, and risks, rather than a prediction alone.
- Disclosure: Review holdings, compensation, conflicts, and other required disclosures.
- Evidence: Compare reported figures with exchange filings and company documents.
- Time horizon: Establish whether the view concerns intraday activity, a business cycle, or long-term fundamentals.
- Accountability: Question deleted calls, altered timestamps, and claims that cannot be independently verified.
A target price or stop-loss in third-party research is an attributed view, not a Bharatstox recommendation or a certainty. Readers reviewing multibagger stock research for Indian investors should apply the same verification standard to every external source.
A short educational video can reinforce the difference between evidence-led research and unverified tips:
This SEBI-registered research analyst guide explains the relevant regulatory context. Analysis is a skill to practise, not a stream of predictions to consume.
Building Your Stock Analysis Workflow
A repeatable workflow turns scattered information into a decision record. It also makes it easier to identify whether an error came from the business thesis, the valuation, the chart interpretation, the position size, or an unexpected event. The process below is educational, not a personalised investment recommendation.
Start with a written question
Define the question before opening a chart. It might concern an industry's demand outlook, a company's cash generation, or whether a recent announcement changes the original business thesis. Then identify the evidence that could support or weaken that view.
A practical sequence is:
- Set the context. Review sector conditions, RBI policy, currency, commodity exposure, and relevant market flows without assuming that any one factor determines the outcome.
- Screen the business. Compare revenue quality, operating margins, ROE, debt, cash conversion, promoter disclosures, and valuation with relevant peers.
- Read primary documents. Check the latest results, annual report, investor presentation, shareholding filing, and material announcements.
- Map the risks. Write down customer concentration, debt refinancing, regulation, execution, governance, liquidity, and competition risks.
- Use charts as a second lens. Examine trend, support and resistance zones, volume, gaps, and the timeframe that matches the intended holding period.
- Define exposure before action. Position sizing should reflect portfolio capital, liquidity, correlation with existing holdings, and the maximum loss the investor can financially and emotionally tolerate.
Keep an audit trail
A research journal should record the date, thesis, evidence, assumptions, valuation approach, chart observations, planned review conditions, and final outcome. It should also distinguish between an outcome caused by sound process and one caused by luck. Reviewing the journal can expose recurring habits, such as buying after sharp moves, ignoring contradictory filings, or changing the thesis after price volatility.
Risk controls aren't only technical levels. They include diversification, cash-flow awareness, avoiding borrowed money, checking tax treatment, and understanding the product being traded. Derivatives require particular care because borrowed money can magnify both gains and losses. Never copy a position size from someone else's account.
Compliance belongs in the workflow too. SEBI guidance requires registration for analysts offering paid research services, and readers should distinguish registered research from casual opinion. Before acting on external material, check the source, disclosure, timestamp, method, and conflict information.
Bharatstox brings together attributed research calls, bylined market news, NSE and BSE corporate filings, live market panels, and educational explainers for Indian retail investors. Visit Bharatstox to follow market developments with clearer sourcing and build a more disciplined stock-analysis routine.
Disclaimer
This article is for informational and educational purposes only and does not constitute investment advice or a recommendation. Investing in securities markets is subject to market risks. Read all related documents carefully before investing.