Intraday vs Swing Trading in India: A Clear Comparison
Intraday vs swing trading in India explained with side-by-side comparison of time horizon, capital, risk, costs, and which style suits your profile.
SEBI's FY23 study found that 71% of individual intraday traders in India lost money, with an average loss of about ₹5,371 per trader. That figure changes the usual intraday versus swing trading debate: the central issue isn't just speed or patience, but whether a trader's method can overcome costs, execution pressure and regulatory constraints. (SEBI study)
Table of Contents
- The Core Question Indian Retail Traders Are Asking
- Intraday and Swing Trading Defined in Indian Markets
- Side-by-Side Comparison Across Time, Capital and Risk
- Cost Stack and Breakeven Math for Each Style
- How India's 2026 Market Cycle Is Reshaping the Trade-Off
- Which Style Fits Which Trader Profile
- A Neutral Decision Framework Before You Choose
The Core Question Indian Retail Traders Are Asking
For an Indian retail trader, choosing between intraday and swing trading sets two different operating routines. Intraday trading opens and closes a position within one market session. Swing trading holds a position for several days or weeks, allowing a broader price move to develop.
The trade-off begins with exposure and execution. Intraday positions avoid overnight gaps, but they demand decisions inside a fixed session and leave less room for delays, slippage or repeated charges. Swing positions reduce the need for constant screen time, while leaving the trader exposed to news, global moves and price gaps before the next session.
Participation has expanded sharply. SEBI's FY23 study recorded individual intraday traders increasing from around 15 lakh in FY19 to 69 lakh in FY23, a 4.6x rise. That growth matters because more participants are entering a format where frequent execution can make brokerage, STT, exchange charges and other levies a larger part of the result. The loss findings cited earlier show why participation growth should not be mistaken for evidence that the method is easy.
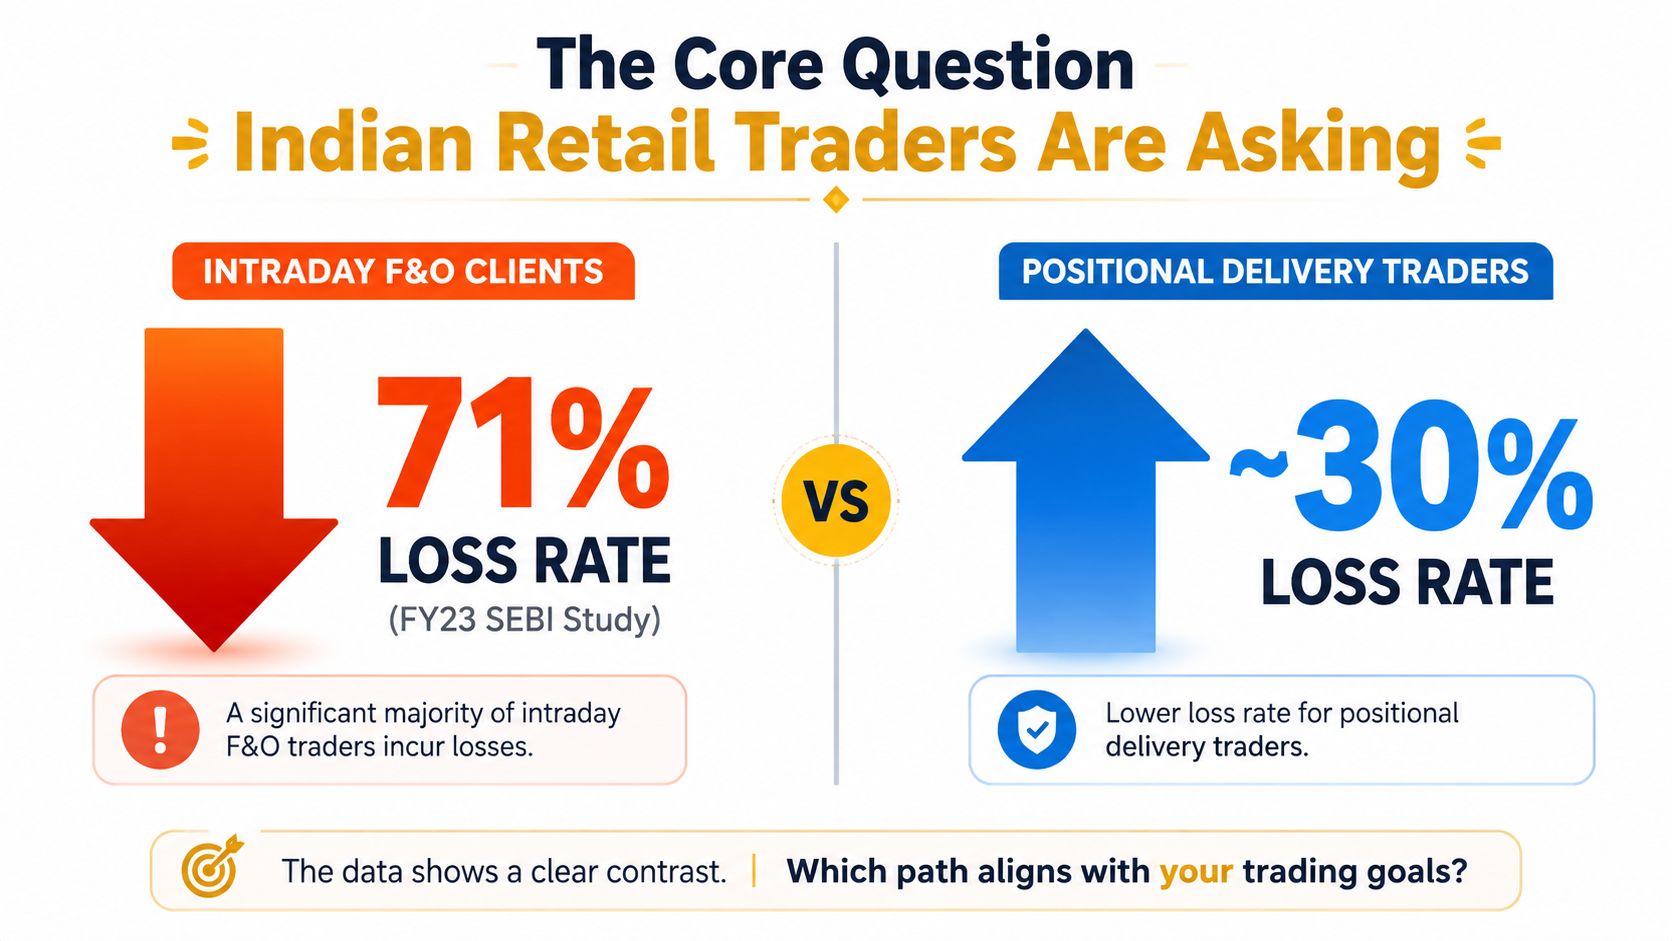
The infographic requires careful interpretation. The SEBI evidence discussed here covers individual intraday traders in the equity cash segment, whereas the supplied visual compares intraday F&O clients with positional delivery traders. These are different categories, so the figures do not provide a like-for-like comparison. They do, however, point to a practical issue: a trader needs a price move large enough to cover the full local cost stack before a trade can break even.
The practical question: can the expected move cover taxes, brokerage, exchange charges and execution friction, while still fitting the trader's available time and risk tolerance?
A detailed comparison of day and swing trading styles offers broader context, but Indian traders must apply that framework to local rules, margin requirements and transaction costs. The choice therefore depends on capital, attention, tools and tolerance for overnight risk.
This article presents both approaches without recommending either one. It examines how each works in India, where costs affect the breakeven move and which personal constraints should shape the decision.
Intraday and Swing Trading Defined in Indian Markets
Intraday equity trading involves buying and selling a position within the same NSE or BSE session. The trader doesn't take delivery of the shares. In a typical cash-equity intraday transaction, securities transaction tax, or STT, applies on the sell side at the applicable rate, while the trader also faces brokerage, goods and services tax, exchange charges, SEBI turnover fees, stamp duty and possible slippage.
The market clock creates a hard boundary. NSE's regular equity session runs from 09:15 to 15:30 IST, with pre-open beginning at 09:00 IST. An intraday trader therefore has a defined window in which to enter, manage and square off positions. (NSE market timings and holidays)
Swing trading holds a position overnight, generally for several days or weeks. In cash equities, this normally means delivery-based trading. Delivery trades attract STT on both the buy and sell sides at 0.1%, according to the cost information supplied for this comparison. The trader must also consider overnight gaps, corporate announcements, global market moves and the possibility that the next available price differs materially from the previous close. (Indian trading cost breakdown)
The regulatory treatment matters. NSE requires upfront collection of margins such as Value at Risk, or VaR, and Extreme Loss Margin, or ELM, before trade execution. Its member FAQs also explain how margin held on trade day can count towards peak-margin obligations if it remains available until pay-in day. (NSE margin collection FAQs)
Why the session clock and settlement matter
Intraday traders seek to finish flat by the close, which removes overnight gap exposure but increases dependence on live execution. Swing traders gain more time to assess a setup, yet their position remains exposed when the exchange isn't open.
India's T+1 settlement cycle also shapes delivery-based activity. A swing trader must understand that buying shares for delivery isn't the same operational process as opening and closing an intraday position. The account needs sufficient funds, the broker's product classification must be clear and the trader must know whether an order is being placed as intraday or delivery.
The peak-margin regime is another dividing line. SEBI's framework was fully implemented from September 2021, with exchanges checking the highest margin usage through multiple random intraday snapshots. (Peak-margin framework explained)
For readers building a foundation, Bharatstox's explainer on what swing trading means provides a related introduction, while insights for disciplined traders can help clarify the routines and controls associated with day trading.
Side-by-Side Comparison Across Time, Capital and Risk
The difference between the two styles becomes clearer when viewed through four practical questions: how long the position stays open, how much capital is available, how much attention the trader can give the market and what type of risk they can tolerate.
The holding period is the most visible distinction. Intraday decisions may unfold within minutes or hours, while a swing position remains open across multiple sessions. The slower format doesn't remove risk, but it reduces the need to react to every small price fluctuation.
Capital requirements are more complicated than a single minimum balance. A small account can technically place trades, but limited capital makes fixed charges and percentage-based costs more significant relative to each position. The plan notes commonly cited broker guidance of ₹1 lakh as a minimum and ₹2 lakh to ₹5 lakh as a practical swing-trading range isn't included in the verified data, so it shouldn't be treated as an established threshold. What can be said safely is that capital must cover the position, applicable margins and the possibility of losses without forcing rushed decisions.
| Dimension | Intraday Trading | Swing Trading |
|---|---|---|
| Holding period | Opened and closed within the same session | Held overnight for several days or weeks |
| Market exposure | No planned overnight exposure | Overnight and weekend exposure |
| Time demand | Requires attention during the NSE session, from 09:15 to 15:30 IST | Allows scheduled reviews rather than continuous monitoring |
| Cost pattern | Frequent round trips can multiply brokerage, taxes and slippage | Lower trade frequency can reduce repeated transaction friction |
| Margin context | Upfront VaR and ELM collection, with peak usage monitored during the day | Delivery funding and overnight risk remain central |
| Main operational risk | Fast execution, slippage, overtrading and intraday volatility | Gaps, news shocks and capital remaining committed |
| Feedback cycle | Fast, because outcomes arrive within the session | Slower, because the thesis develops across sessions |
| Psychological pressure | High decision tempo and potential decision fatigue | Greater need for patience during temporary drawdowns |
SEBI's data also shows why frequency deserves attention. The intraday loss rate rose to 80% among individual traders placing more than 500 trades a year, and traders with annual turnover above ₹1 crore recorded an average loss of ₹34,977. (SEBI loss-rate reporting by Economic Times)
That doesn't prove that every swing trader will outperform every intraday trader. It does show that high activity can expose a retail account to a particularly fragile cost and execution profile.
Cost Stack and Breakeven Math for Each Style
A profitable trade must first cover its entire cost stack. That can include brokerage, STT, GST, exchange transaction charges, SEBI turnover fees, stamp duty and slippage. The final amount depends on the product, broker, order structure, state and whether the position is intraday, delivery or a derivative.
The cited cost reference lists NSE cash transaction charges at about 0.00297%, a SEBI turnover fee of ₹10 per crore, intraday equity STT at 0.025% on the sell side and commonly ₹20 per order brokerage. GST applies to brokerage plus exchange and SEBI charges. (Indian trading cost calculator)
The supplied figures do not establish one exact rupee total. Stamp-duty state, order count, broker plan, buy and sell values, and slippage would all be needed. The comparison therefore identifies the inputs that shape breakeven rather than presenting a misleading fixed result.
| Cost Components | Intraday, ₹50,000 round trip | Swing or delivery, ₹2,00,000 round trip | Notes |
|---|---|---|---|
| Brokerage | Broker-dependent, commonly ₹20 per order in the supplied data | Broker-dependent | Confirm whether entry and exit are charged separately |
| STT | 0.025% on the sell side | 0.1% on both buy and sell sides | Product classification changes the tax treatment |
| Exchange transaction charge | About 0.00297% on NSE cash trades | About 0.00297% on NSE cash trades | Applied to turnover under the cited cost reference |
| SEBI turnover fee | ₹10 per crore | ₹10 per crore | Turnover-based charge |
| GST | Applied to brokerage plus exchange and SEBI charges | Applied to brokerage plus exchange and SEBI charges | The taxable base matters |
| Stamp duty | Varies by state and transaction type | Varies by state and transaction type | Confirm the applicable state rate |
| Slippage | Market and order dependent | Market and order dependent | Not a fixed statutory charge |
| Breakeven move | Must exceed the full debit on the ticket | Must exceed the full debit on the ticket | Calculate after all charges, not from STT alone |
Turning charges into basis points
A basis point equals one-hundredth of a percentage point. To estimate the required price move, add every rupee charge, divide the total by the relevant turnover or position value, and convert the result into basis points. Use the same denominator for every item.
For a ₹50,000 intraday round trip, covering STT alone is not enough. Brokerage, GST, exchange charges, SEBI fees, stamp duty and slippage all reduce the amount left from the price move. The calculation must therefore connect the expected move with the full debit on the ticket.
A ₹2,00,000 delivery position has a different profile. The two-sided STT treatment can raise the statutory cost even when the trader makes fewer transactions. Lower frequency may reduce repeated brokerage and execution friction, but it does not guarantee a lower total rupee loss or a profitable outcome.
The same method applies to cash equity, an index stock or an F&O lot, while the line items change. Futures and options have separate margin, tax and charge rules, and the supplied evidence identifies derivatives as a segment-specific cost problem. Before judging whether a small expected move is meaningful, enter the exact buy value, sell value, order count, product type, broker charges and state stamp duty into a calculator.
Bharatstox's intraday trading calls show how same-session market commentary may be presented. Commentary does not remove the need to calculate each trade's charges independently.
How India's 2026 Market Cycle Is Reshaping the Trade-Off
Recent participation data points to a cooling in hyperactive derivatives activity. FY26 coverage cited in the supplied evidence reported that retail participation in F&O fell 20%, losses fell 18%, and total F&O turnover declined to ₹202 lakh crore from ₹213 lakh crore in FY25. (FY26 F&O participation report by Zee Business)
Those figures don't establish that traders have shifted into swing trading. A fall in participation can also mean that people stopped trading, reduced position size or left derivatives altogether. That distinction matters because lower retail churn isn't automatically evidence of more disciplined behaviour.
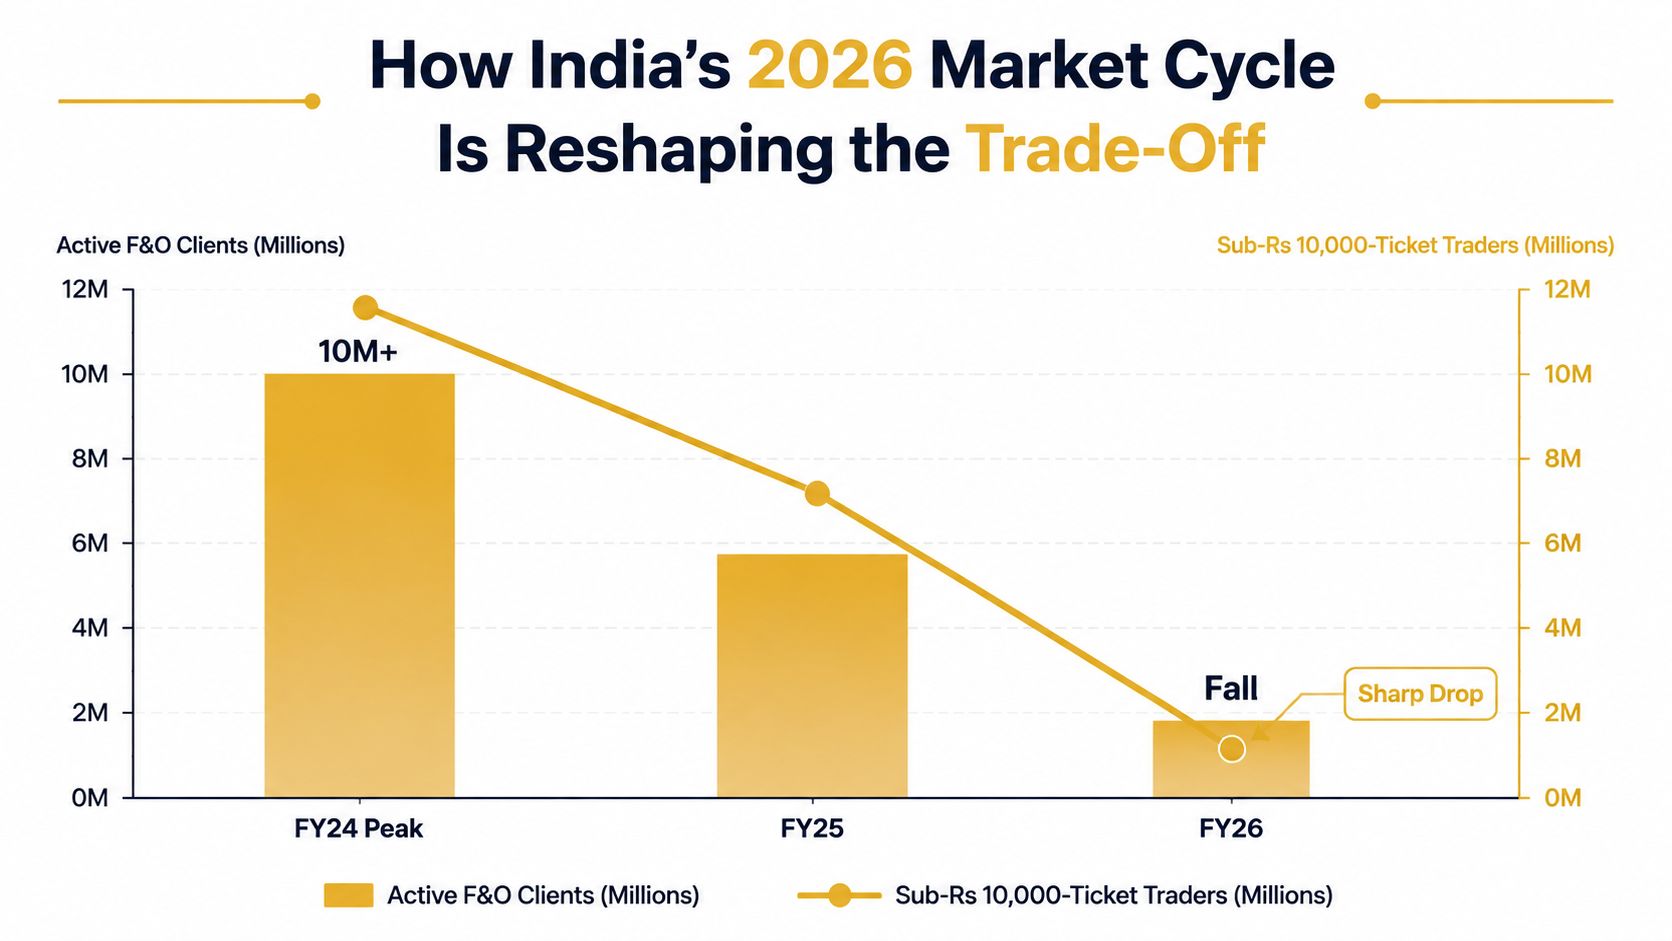
The mechanical implication is straightforward. When a trader makes fewer transactions, the account has fewer opportunities to pay fixed brokerage and repeated exchange-related charges. A swing trader can still lose through a gap or a failed thesis, but the lower frequency may reduce the cumulative friction that high-turnover intraday activity creates.
The shift also raises questions about liquidity and execution. A trader working in a thinly traded name may face a larger difference between the displayed price and the eventual fill, particularly when the position is opened or closed under time pressure. That's a qualitative risk, not a verified market-wide statistic, and it varies substantially by security and session conditions.
What the data does and doesn't say
India's cost structure makes the comparison more nuanced than “intraday is faster, swing is safer”. Cash delivery attracts STT on both sides, while cash intraday applies STT on the sell side only at the supplied rates. Derivatives have their own rules, and the supplied 2026 market explainer notes that derivatives STT changed while cash intraday and delivery STT stayed unchanged. (2026 STT explainer)
A trader comparing styles should therefore examine net outcome after charges, not headline price movement. Bharatstox's stock-market analysis coverage can help readers follow session context and market developments, but it can't substitute for a personal record of costs, fills and realised losses.
Which Style Fits Which Trader Profile
There's no universal winner in intraday versus swing trading. The better fit depends on whether the trader's schedule, capital and temperament match the demands of the method.
| Trader Profile | Time Available | Typical Capital | Risk Tolerance | Style Fit |
|---|---|---|---|---|
| Salaried beginner | Limited during 09:15 to 15:30 IST | Smaller account, potentially below ₹1 lakh | Low to moderate | Swing or delivery may fit the schedule better |
| Working professional | Flexible access during part of the session | Moderate account, potentially ₹2 lakh to ₹5 lakh | Moderate | A clearly separated hybrid process may be workable |
| Active F&O participant | Regular session attention | Capital sufficient for margin and mark-to-market demands | High, with strict controls | Intraday only if the trader understands margin and execution risk |
The first profile often faces a time problem rather than a knowledge problem. Someone working a 9-to-6 job can't reliably watch the screen through the NSE session, respond to fast price changes and square off positions without interruption. A swing format allows research and review outside market hours, though it carries overnight risk and still requires a defined process.
The second profile may have more flexibility, but a hybrid approach creates an extra bookkeeping challenge. The trader must keep swing positions and intraday positions separate, track their costs independently and avoid allowing a losing intraday trade to alter an unrelated delivery decision. A flexible afternoon doesn't automatically create an intraday edge.
The third profile understands margin, mark-to-market movement and the consequences of a peak-margin breach. That trader still needs to size positions so one adverse move doesn't destabilise the account. Familiarity with derivatives terminology isn't the same as having a tested execution process.
Profile fit matters more than labels. A method that works with a trader's available attention is more realistic than one chosen because it appears faster or more exciting.
Readers looking for general educational material can see swing trading tips at Altymo. For a related longer-horizon framework, Bharatstox also explains what positional trading means. Neither resource removes the need to assess personal risk capacity or verify charges with a broker.
A Neutral Decision Framework Before You Choose
A useful decision grid starts with questions, not with a preferred label. The purpose is to identify which operating conditions a trader can sustain.
| Decision Factor | Favours Intraday | Favours Swing | Hybrid Approach |
|---|---|---|---|
| Screen time | You can monitor the market during 09:15 to 15:30 IST | You can review positions at scheduled intervals | Reserve fixed windows for intraday and separate reviews for swing positions |
| Capital base | Funds can meet upfront margin and absorb intraday costs | Funds can remain deployed through overnight moves | Allocate distinct risk budgets to each style |
| Tools | Reliable live charts, execution tools and, where relevant, Level 2 data or broker API access | Daily charts, alerts, research and a dependable order platform | Use fast tools only for the intraday sleeve and simpler tools for swing analysis |
| Risk tolerance | You can accept rapid losses and follow pre-defined limits | You can tolerate overnight gaps and temporary drawdowns | Decide in advance which risk belongs to which strategy |
Four questions to answer honestly
How often can you review the market? If you can't monitor positions during the session, intraday trading creates an operational problem before it creates a market problem. If you can review only periodically, swing trading may align more closely with your availability, though it still carries gap risk.
Can your capital support the format? Intraday activity can accumulate charges quickly, while swing positions can keep capital committed for longer. Compare the cash required, margin obligations, transaction costs and loss capacity rather than focusing only on the amount needed to place the first order.
Do your tools match the tempo? Fast trading depends on stable execution and real-time information. A slower approach can use alerts and scheduled chart reviews, but neither style works well without accurate order records and a way to review decisions.
Which risk can you explain clearly? Intraday traders face execution pressure and peak-margin controls. Swing traders face overnight news and gaps. If you can't describe how a loss could occur, the method isn't yet understood well enough to deploy capital.
The framework points towards intraday, swing or a hybrid process, but it doesn't produce a personalised answer. This is for informational and educational purposes only and not investment advice. Consult a SEBI-registered adviser before investing.
Bharatstox publishes market journalism, corporate-filing explanations, live market panels and attributed material from SEBI-registered research analysts, with visible bylines and timestamps. Visit Bharatstox to follow Indian market developments and build a clearer, evidence-based understanding of intraday and swing trading.
Disclaimer
This article is for informational and educational purposes only and does not constitute investment advice or a recommendation. Investing in securities markets is subject to market risks. Read all related documents carefully before investing.