What Is Positional Trading in India: A Clear Guide
What is positional trading? Learn how it works on NSE and BSE, typical time horizons, strategies, risks, and how it differs from intraday and investing.

Positional trading means holding a trade for days to weeks on the NSE or BSE, rather than squaring it off within the same session or keeping it as a long-term investment. Its middle-ground nature matters because Indian retail traders must account for delivery, settlement, overnight risk, margin, and taxes, not just the direction of price.
You may be looking at a trading terminal late in the afternoon, deciding whether to close a Reliance or NIFTY 50 position before the market session ends or carry it into next week. Closing the position the same day keeps it within intraday trading. Carrying it for several sessions makes it a positional trade, provided the trade is managed actively rather than treated as a passive investment.
The distinction sounds simple, but the mechanics are different. A positional trader accepts overnight news, follows a defined thesis, monitors liquidity and corporate events, and plans an exit. A long-term investor usually evaluates the business over a much longer period. An intraday trader focuses on movements within one session.
A positional call, therefore, should be understood as a time-bound research view, not a promise or a tip. On an education and market-data platform such as Bharatstox's guide to trading platforms in India, the useful question isn't whether a security may rise or fall. It's whether the published view has a stated horizon, rationale, risk framework, and accountable source.
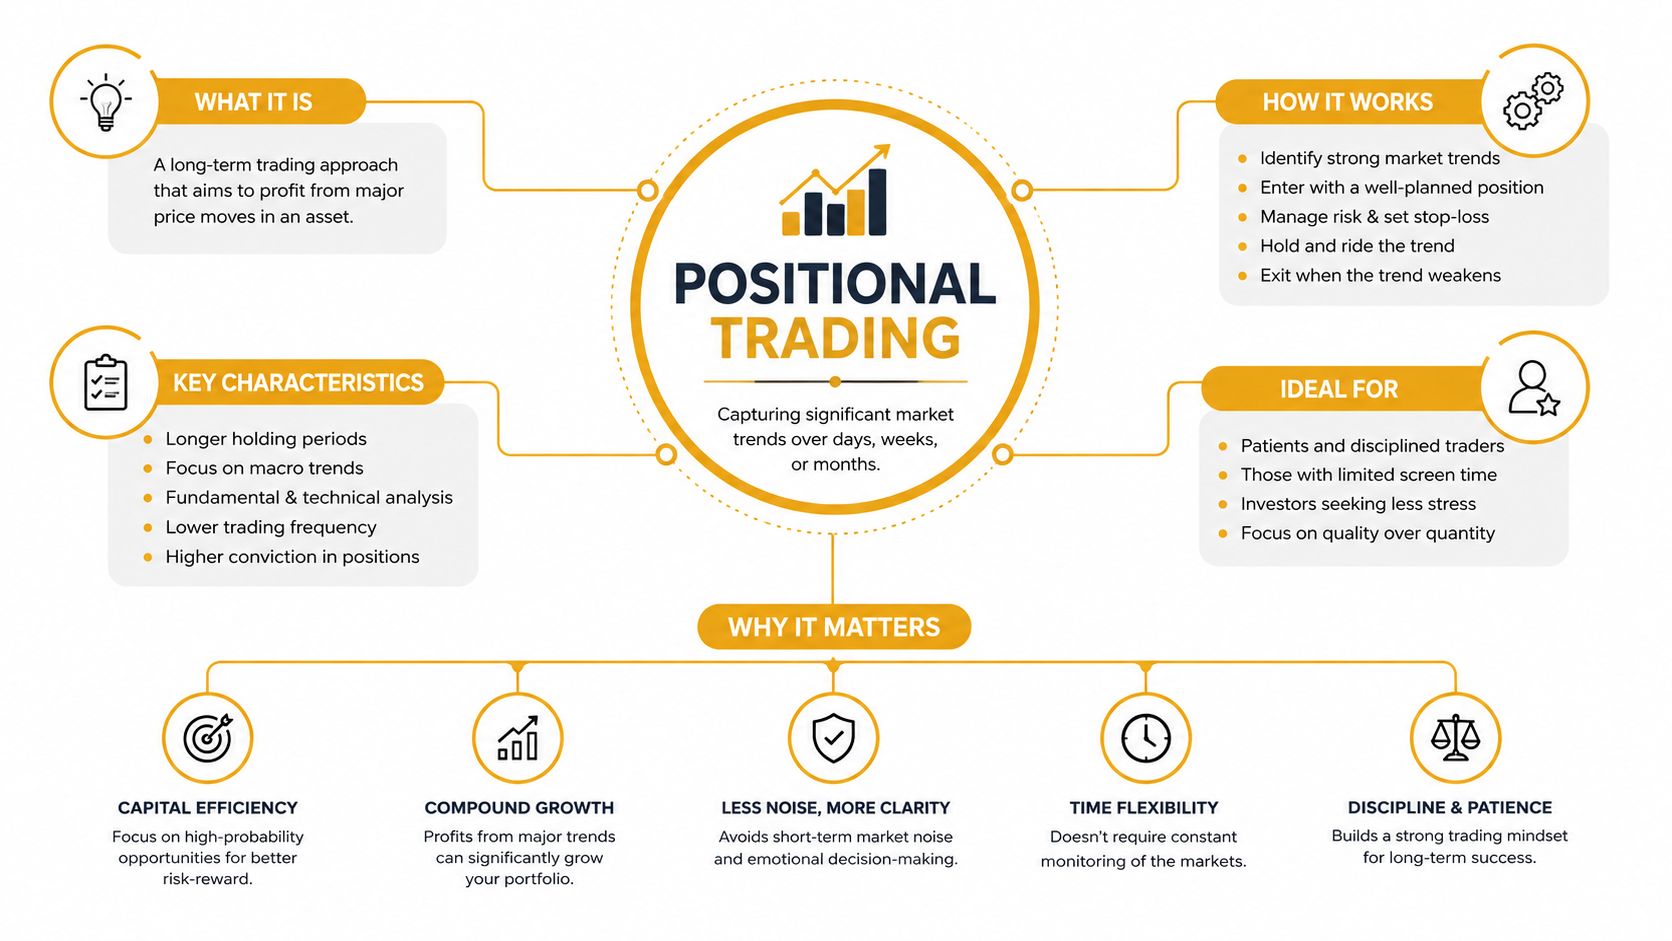
Table of Contents
- What Is Positional Trading and Why It Matters
- How Positional Trading Differs from Intraday, Swing, and Investing
- Typical Time Horizons and How a Positional Trade Flows
- Common Strategies and Indicators Used by Positional Traders
- Risk Management Rules That Actually Matter in India
- Example Positional Trades on NSE and BSE
- Common Misconceptions About Positional Trading
- Key Takeaways and Frequently Asked Questions
What Is Positional Trading and Why It Matters
You buy an NSE share after a breakout, but the move needs several sessions to develop. Selling before the closing bell would turn the idea into an intraday trade. Keeping the position overnight, with a defined reason and exit plan, makes it a positional trade.
Positional trading is an active trading style in which a trader holds a market position beyond the trading session, commonly for several days or weeks. The position may use the equity cash market or derivatives. Its purpose is to participate in a medium-term price move, while the trader continues to review the original thesis.
An intraday trader closes before the session ends. A positional trader accepts overnight exposure because the expected move may take time. A long-term investor usually bases the decision on a business or asset-allocation view that extends far beyond one market move. The labels can overlap, but the holding intention and management process remain different.
Why the middle ground has consequences
Holding beyond the session introduces risks that do not arise in the same way for a squared-off intraday position. Results, central-bank decisions, global markets, corporate announcements, and opening gaps can change the price before the exchange reopens. A position that appeared manageable at one close may require a different response the next morning.
India's settlement process also shapes the trade. The cash market uses T+1 settlement, so shares bought on a trading day are credited to the demat account on the next working day, as described in SEBI's settlement-cycle material. Settlement determines when delivery is completed. It does not protect the position from price risk, margin requirements, or a gap at the open.
Tax treatment may depend on how long listed equity shares are held. Holdings of 12 months or less are treated as short-term capital gains at 20% under Section 111A. Holdings beyond 12 months fall under long-term capital gains at 12.5% under Section 112A, after an annual exemption of ₹1.25 lakh, according to this Indian tax explainer.
A positional trade should therefore record its thesis, expected time horizon, invalidation condition, and exit process before entry. Bharatstox's guide to trading platforms in India provides useful context for evaluating the tools used to monitor such positions.
The style offers more time than intraday trading, not automatic safety. The trader exchanges same-day intensity for overnight exposure, funding needs, and the discipline to prevent a temporary loss from becoming an unmanaged investment.
How Positional Trading Differs from Intraday, Swing, and Investing
The boundaries between trading styles aren't universal. Indian retail participants often use “swing” and “positional” interchangeably, especially when both trades last beyond one session. The practical difference is usually the intended horizon, the strength of the thesis, and how actively the trade is managed.
| Style | Holding Period | Settlement in India | Typical Objective |
|---|---|---|---|
| Intraday trading | Within one market session | Positions are squared off within the session and don't become delivery holdings | Capture short-term price movements |
| Swing trading | A few sessions to several weeks | Cash-market positions may settle through the applicable delivery cycle | Capture a shorter price swing |
| Positional trading | Several days to weeks, sometimes longer | Positions can remain open overnight and may involve delivery or derivatives | Participate in a broader medium-term move |
| Long-term investing | Extended periods, often years | Shares are held as investments after settlement | Participate in business or market compounding |
The key mechanical difference
Intraday trading concentrates attention on the session. A positional trade introduces overnight exposure, so the trader must consider what may happen when the exchange is closed. A cash-market purchase that remains in the account is different from a same-day trade, even if the original price view was similar.
Capital requirements also depend on the segment. A cash position ties up the value of the shares, while a derivative position uses margin but can create obligations that aren't obvious from the amount paid upfront. That makes the headline price of a contract a poor substitute for understanding total capital exposure.
Swing trading generally describes a shorter move within the broader positional category, but there's no single exchange rule that creates a universal line. A research platform may still label calls separately because the label tells readers how long the originating analyst expects the idea to remain relevant.
Taxes create another distinction from long-term investing. A trade closed within the short-term holding window can have different tax treatment from a share held beyond the long-term threshold. The holding period, not the trader's personal description of the activity, becomes important for listed equity taxation.
For beginners, the simplest test is this: Was the position intended to be managed beyond today, with a defined medium-term thesis? If yes, it is closer to positional trading than intraday activity. For a plain-language introduction to the shorter-horizon category, see Bharatstox's explanation of swing trading.
Typical Time Horizons and How a Positional Trade Flows
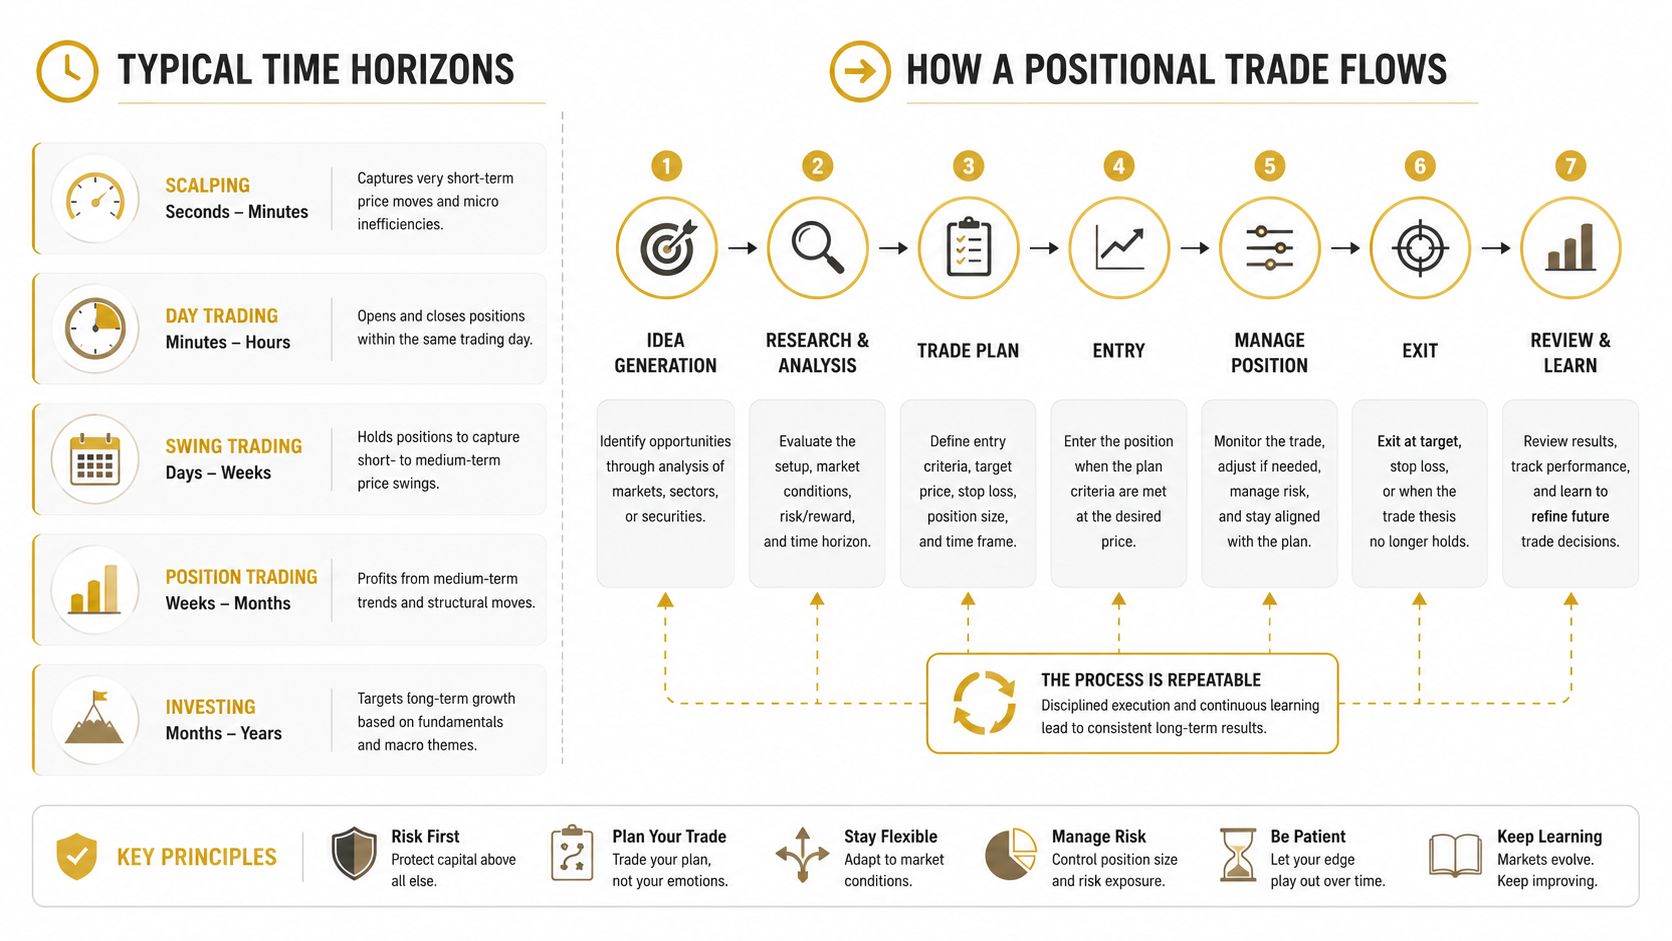
An NSE trader buys a stock after a breakout, expecting the move to develop over several weeks rather than closing the position before the market shuts. That is the practical setting for positional trading. There is no fixed expiry as there is with a futures contract. A trade may last a handful of sessions, several weeks, or a few months, depending on the thesis and the event that could invalidate it.
The work starts before the order. The idea might come from earnings, sector rotation, a technical breakout, a change in market structure, or a corporate announcement. The entry reason should be specific enough to test later, like a route on a map that can be checked against the journey.
A cash-market flow
A simplified cash-market sequence looks like this:
- Form a thesis: Define the market behaviour that would support the idea and the evidence that would weaken it.
- Select the segment: Choose equity cash or derivatives, recognising that margin, obligations, and risk can differ.
- Place the order: Check quantity, product type, order type, and available funds through the broker.
- Account for settlement: India's T+1 cycle generally credits shares on the next working day after the trade, subject to the applicable settlement process.
- Monitor participation: Delivery percentage means deliverable quantity divided by total traded quantity. It shows how much activity resulted in delivery rather than only intraday turnover.
- Review the thesis: Results, filings, news, price behaviour, or liquidity can change the original view.
- Exit and record: Close the trade when the thesis works, fails, or needs reassessment. Record the outcome and relevant tax category.
Delivery percentage is a filter, not a standalone buy or sell signal. NSE delivery-volume guidance presents commonly used ranges for interpreting participation, including readings below 20%, 35% to 55%, and above 55%. These figures need context because a high reading does not prove that price will rise.
A high delivery reading suggests that more market participants carried shares beyond the session. It does not reveal whether their reasons were sound. A low reading may reflect speculation, but it does not by itself show whether the move is useful or dangerous. Positional traders combine the measure with liquidity, trend, news, and the original thesis. In India, T+1 settlement and delivery activity help describe what happened after the order, while the thesis determines what the trader should do next.
Common Strategies and Indicators Used by Positional Traders
Positional traders often use technical indicators as filters, not as automatic instructions. The chart can help organise information, but it can't remove event risk, liquidity risk, or the possibility that a public assumption is already reflected in price.
Trend-following
Trend-following traders look for a sustained direction rather than a single price jump. Moving averages, such as the 50-day and 200-day averages, can help compare the current price with its broader path. A trader studying the NIFTY 50 might treat a price above a rising average as supportive context, while recognising that a moving average reacts after the trend has already developed.
The common misread is to treat a crossover as a guarantee. A sideways market can produce repeated signals that reverse quickly, especially when the index or stock lacks a clear catalyst.
Momentum and breakouts
Momentum analysis examines whether price is moving with enough strength to escape a prior range. A breakout from a consolidation zone may attract attention, particularly around earnings, the Union Budget, or an RBI policy decision. Volume and delivery percentage can help distinguish a move with wider participation from one driven by limited activity.
The danger is a false breakout. Price may move beyond a range briefly, attract late entries, and then return inside it. A positional trader therefore needs to define what would confirm the move and what would invalidate it, rather than relying on the word “breakout”.
Mean reversion and events
Mean-reversion traders look for an extended move that may return towards a previous average or support area. RSI, or the Relative Strength Index, is often used to identify whether recent price action appears stretched. An oversold reading doesn't automatically mean a fall is over, just as an overbought reading doesn't prove that a rise must end.
Event-driven trades focus on a known development, such as company results, a dividend record date, or index rebalancing. The event can create volatility in either direction. A disciplined analysis asks what is already expected, what the event could change, and whether the position can absorb a gap.
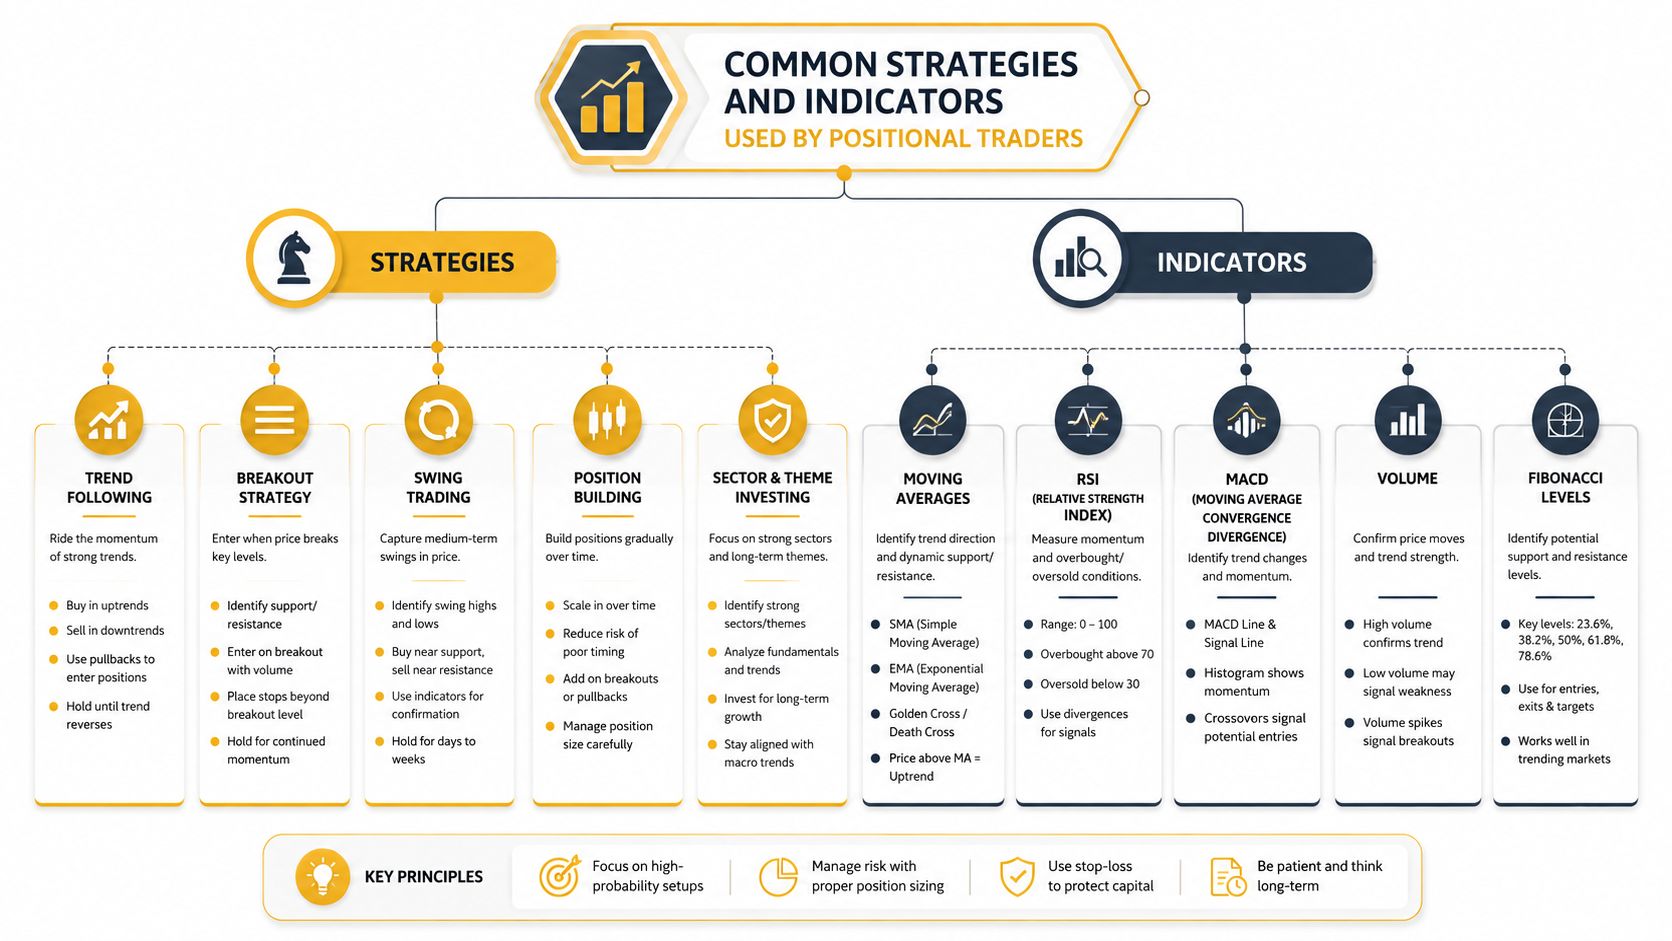
A useful workflow combines a trend filter, momentum confirmation, and a volume or delivery check. It also verifies corporate-action dates and exchange announcements. Bharatstox publishes attributed research calls organised by horizon, including positional classifications, allowing readers to inspect how analysts describe the thesis, time frame, and risk context.
No indicator can substitute for position sizing. A technically attractive chart can still be unsuitable if the contract is illiquid, the event risk is misunderstood, or the capital required to carry the trade is larger than expected.
Risk Management Rules That Actually Matter in India
A positional trade can look right on the chart and still be too risky for the account. An overnight gap, a larger-than-expected margin call, or thin liquidity can turn a manageable idea into an outsized loss. Risk management therefore starts with the capital committed and the conditions for carrying the position.
A useful framework separates market risk, capital risk, and market-structure risk. Market risk is the effect of price movement. Capital risk covers margin, funding, and drawdown. Market-structure risk includes liquidity, expiry, delivery obligations, settlement, and position limits.

Capital and margin
In India, the cash needed to open a position is not the same as the position's full exposure. SEBI-linked rules require at least 20% upfront margin before a trade, while mark-to-market and delivery margin can continue until settlement, as explained in SEBI's margin FAQ. A trader should therefore assess both the notional value and the cash buffer needed if the position moves against the view.
For physical-delivery positions, the derivatives framework sets margin at VaR on the futures invoice price plus 5% of face value, with mark-to-market adjustments on both sides. It also caps gross open client positions in exchange-traded derivatives at 6% of total open interest or ₹300 crore, whichever is higher, as described in SEBI's derivatives framework.
Position limits and execution discipline
SEBI's 2025 framework links market-wide futures and options position limits to the lower of 15% of free float or 65 times average daily cash volume. Exchanges also monitor intraday positions more closely under the framework, as set out in SEBI's updated trading framework.
The practical lesson is simple. A sound market view does not remove constraints created by liquidity, expiry, margin, or compliance rules. Before using a derivative as a substitute for a share, check its contract specifications, open interest, liquidity, and delivery terms. For cash-market holdings, T+1 settlement and the stock's delivery percentage help clarify when shares are likely being carried rather than rapidly turned over.
Risk check: A positional trade is not properly sized until the trader knows the cash required today, how margin could change, and what an overnight gap may do to the account.
Stops should match the trade structure. A recent swing low or high may provide a more meaningful invalidation level than an arbitrary point distance. Gaps can produce execution away from the stop, so position size must allow for slippage and overnight movement.
Corporate actions can also alter both a chart and its interpretation. Before carrying a position through a dividend, split, or other announcement, consult Bharatstox's corporate-action events guide and verify the relevant dates and exchange disclosures.
Example Positional Trades on NSE and BSE
A responsible example must show the mechanics without turning a historical or hypothetical setup into a recommendation. The following framework is illustrative. It doesn't identify a stock, price, target, or analyst call because no verified call details are available here.
Suppose a SEBI-registered research analyst publishes a positional note on an NSE-listed large-cap company after its earnings announcement. The note identifies the company, explains the earnings-related rationale, states the intended horizon, and records the analyst's registration details. A reader studying that note would first verify the publication timestamp, the source of the research, the stated risk condition, and whether the analyst complied with the applicable personal-trading restrictions.
The reader could then examine the cash-market chart, trading volume, delivery percentage, relevant filings, and the T+1 settlement process. Those checks don't establish that the trade will work. They show whether the published thesis is understandable, traceable, and consistent with the trade's stated horizon.
A derivatives example
A second illustration could involve a Bank NIFTY futures position discussed after an RBI policy event. The analysis would need to explain why the event mattered, what invalidated the view, how expiry affected the position, and what margin obligations applied. A futures position isn't a risk-free hedge just because it is described as a hedge. It still carries basis risk, margin risk, liquidity risk, and overnight exposure.
A reader reviewing either example should separate three questions:
- What was published: Identify the named analyst, registration details, timestamp, security or index, and stated horizon.
- What happened mechanically: Track order type, settlement, margin, corporate events, liquidity, and the eventual exit.
- What remains uncertain: A published thesis doesn't guarantee execution, outcome, or suitability for a particular investor.
SEBI's Research Analysts Regulations restrict research analysts, their associates, and employed analysts from trading in securities they recommend or follow within 30 days before and 5 days after publishing a research report on the subject company, according to SEBI's Research Analysts Regulations.
This is for informational and educational purposes only and not investment advice. Consult a SEBI-registered adviser before investing.
For live context, readers can compare market movements and exchange activity through Bharatstox's NSE and BSE live-market coverage. The value of attributed reporting is traceability. Readers can see who issued a view, when it was published, and what the original call said.
Common Misconceptions About Positional Trading
The first misconception is that positional trading is automatically safer than intraday trading. It may reduce the pressure of making decisions within one session, but the trade remains exposed while the exchange is closed. Overnight corporate news, RBI announcements, global cues, and unexpected filings can create a gap before the trader can respond.
The second misconception is that a longer holding period turns trading into investing. It doesn't. A positional trader still needs an active thesis, an exit process, capital discipline, and a willingness to close the trade when the original assumption no longer applies.
The loss statistic needs careful interpretation
SEBI reported that 93% of individual traders in equity F&O incurred losses between FY22 and FY24, with aggregate losses exceeding ₹1.8 lakh crore over three years, according to the SEBI study summary. The data concerns individual equity F&O activity, not every positional trade in the cash market, but it provides important context for retail participation and derivatives risk.
A positional label doesn't remove those risks. Derivatives can require changing margins, carry expiry consequences, and create losses that are larger than a beginner expects from the upfront amount. The 2025 position-limit framework also means that compliance and liquidity conditions can affect a position independently of whether the underlying market view is correct.
A middle ground, not a default
Some investors may prefer diversified long-term holdings or passive products because they don't want to manage event risk and daily trade decisions. Others may study positional methods as an active process. Neither choice can be judged without considering time, capital, costs, taxes, and the investor's ability to follow a written plan.
The honest mental model is simple: positional trading is structured, but it isn't automatically low-risk. It sits between intraday speculation and long-term investing, and its suitability depends on how well the trader understands the trade's mechanics.
Key Takeaways and Frequently Asked Questions
Positional trading means holding a planned market position beyond one session, often for several sessions or weeks. The trader follows a defined thesis and sets conditions for entry, exit, risk, settlement, liquidity, margin, and news. In India, the trade is shaped not only by the chart, but also by T+1 settlement, delivery percentage, corporate actions, and SEBI rules.
Key takeaways
- Holding period: The position stays open beyond the trading day instead of being squared off intraday.
- Indian mechanics: T+1 settlement, delivery percentage, margin collection, corporate events, and derivatives rules can change the trade's practical risk.
- Risk profile: Overnight gaps can move prices before the next session opens. Derivatives also bring margin and expiry obligations.
- Research quality: A positional call should state its time frame, source, publication time, and conditions clearly. It should remain separate from investment advice.
- Tax awareness: The holding period can affect how listed-equity gains are treated for tax purposes.
Does positional trading suit beginners?
It can, provided the beginner understands the product, accepts overnight exposure, follows written rules, and limits risk before placing the order. A derivative may appear affordable because its upfront amount is smaller, but margin changes and expiry can increase the financial pressure. This content is for information and education, not investment advice. Consult a SEBI-registered adviser before investing.
How much capital is required?
No fixed amount suits every positional trade. The requirement depends on the security, segment, quantity, broker conditions, and risk tolerance. The trader must also account for the applicable 20% upfront margin and keep a buffer for mark-to-market or delivery-margin demands, as explained in SEBI's margin FAQ. Requirements can vary by product and market conditions.
How are positional gains taxed?
For listed equity shares held for 12 months or less, short-term capital gains are taxed at 20% under Section 111A. Holdings beyond 12 months are taxed at 12.5% under Section 112A, after an annual exemption of ₹1.25 lakh, subject to the applicable rules and conditions in this Indian tax reference.
Is positional trading the same as delivery investing?
No. Both can involve holding shares after the session ends. Positional trading is actively managed around a medium-term thesis and planned exit, while delivery investing usually follows a longer buy-and-hold objective. Their tax treatment and decision process may also differ.
Bharatstox publishes Indian market journalism, attributed research calls organised by trading horizon, corporate-filing coverage, and live NSE and BSE information. Visit Bharatstox for positional-trading education, timestamps, and source context.
Disclaimer
This article is for informational and educational purposes only and does not constitute investment advice or a recommendation. Investing in securities markets is subject to market risks. Read all related documents carefully before investing.