What Is Swing Trading Explained for Indian Markets
What is swing trading? Learn how it works in India, timeframes, setups, indicators and risk management for NSE and BSE stocks.

Swing trading in India means holding a liquid NSE or BSE stock for about 2 to 15 trading sessions, or a few days to several weeks, to capture one clear price move using daily-chart structure. It sits between intraday trading, where positions close the same day, and positional investing, where the holding period can stretch much longer.
You may be looking at a chart on your phone after work, wondering whether a price move is a tradable swing or just market noise. The answer depends less on finding a dramatic stock and more on understanding the holding period, the chart structure, the settlement process, the costs and the risks.
Table of Contents
- Introduction to What Is Swing Trading
- How Swing Trading Differs from Intraday and Positional Trading
- Timeframes Settlement and Costs Behind Every Swing Trade in India
- Popular Swing Trading Setups and How to Read Them
- Indicators and Trade Management Essentials for Swing Traders
- Sample Swing Trade Illustrations on NSE and BSE Stocks
- Key Takeaways and Common Misconceptions About Swing Trading
Introduction to What Is Swing Trading
You check an Indian stock chart after work. Its price has moved for several sessions, but you need to decide whether the move has structure or is just market noise. Swing trading addresses that middle ground by targeting one directional move rather than every intraday fluctuation or a months-long investment.
A trader studies price and volume, identifies a possible pattern, and plans the entry, exit, and invalidation point across multiple sessions. The position may stay open overnight. In India, that also means considering delivery-based trading, T+1 settlement, brokerage, taxes, and the risk of news affecting the next session. These mechanics distinguish a cash-market swing trade from an intraday position or an F&O trade built around short-term speculation.
For an NSE or BSE stock, the holding window is commonly described as about 2 to 15 trading sessions, or a few days to several weeks, to capture one clear price move through technical analysis and planned entries and exits. The term liquid means the stock usually has enough trading activity for orders to execute without unusually large price differences. Beginners can review this stock-market beginners' guide to build the market basics behind these terms.
The same chart can support different decisions. A sharp move that begins and ends during one session belongs to an intraday framework. A trend held for months is closer to positional trading. A swing trader studies the movement between those time horizons, while remembering that delivery-based gains held for a shorter period may have different tax treatment from longer-held investments.
Core idea: Swing trading attempts to capture a multi-day move. It is not a promise that the move will occur, and a recognisable chart pattern can still fail.
Start with a process rather than a crowded indicator list: define the time horizon, read the daily chart, assess what strengthens or weakens the setup, include settlement and costs, and state what would prove the idea wrong. The India-focused swing-trading guide offers another explanation of this approach.
This Bharatstox explainer is journalism and education, not investment advice. Consult a SEBI-registered adviser before investing.
How Swing Trading Differs from Intraday and Positional Trading
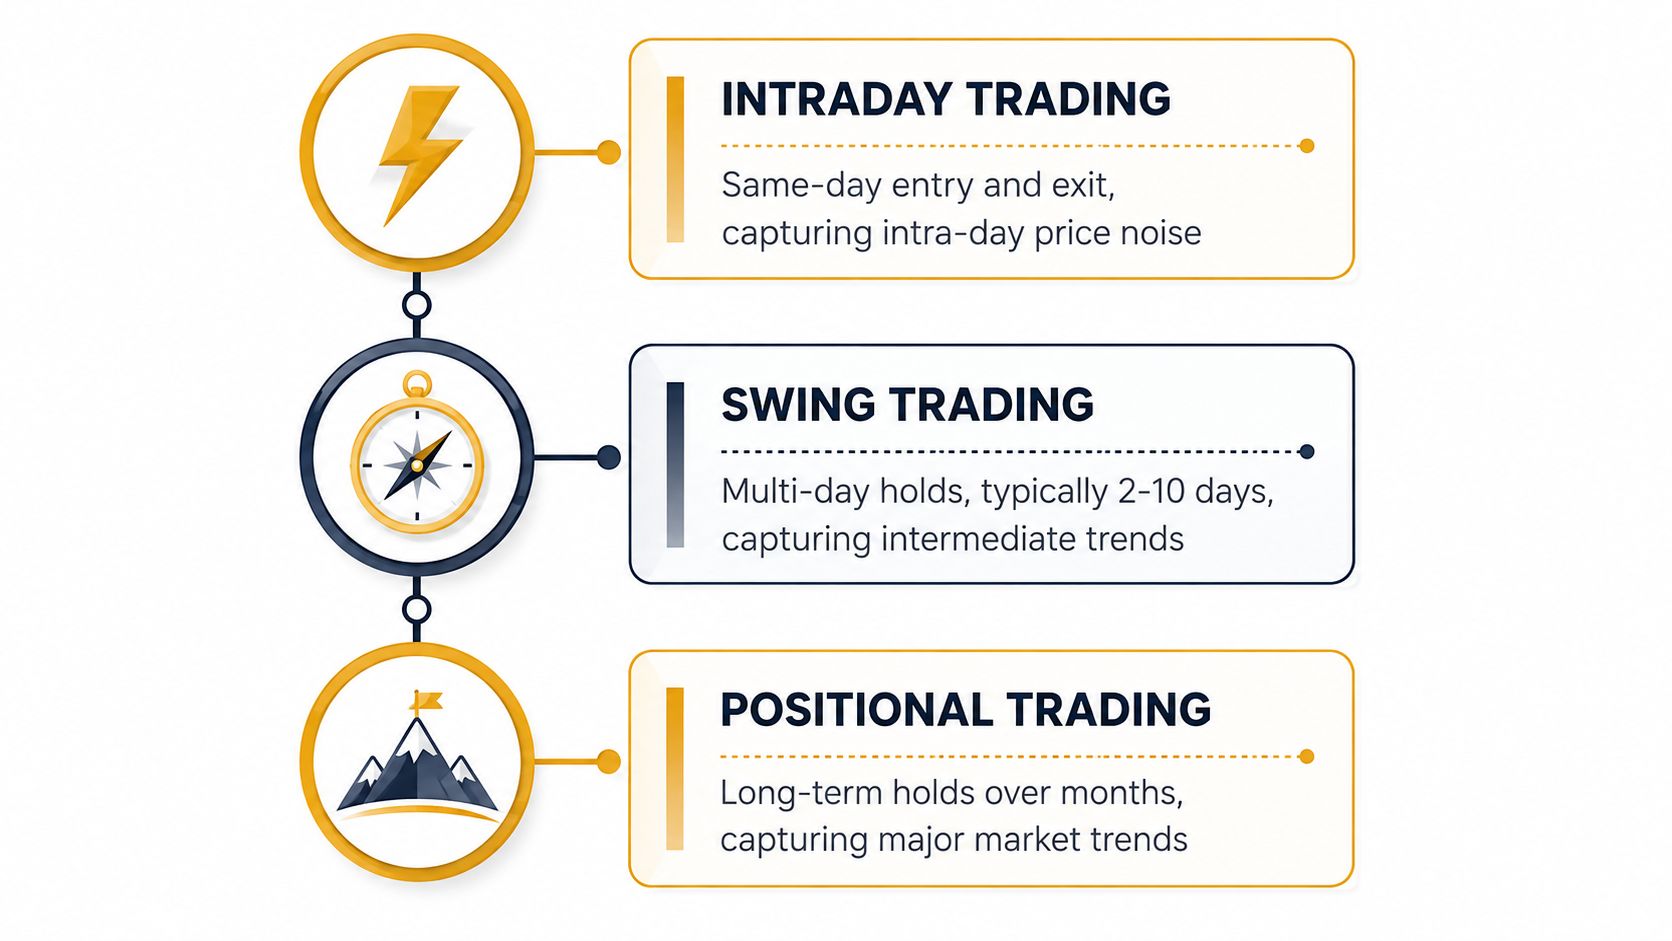
A trader who closes every position before the market shuts follows an intraday approach. Another trader holds a share through several sessions, aiming to capture a defined price move. That is the usual setting for swing trading. Positional trading follows a broader trend and may keep the position open for weeks, months or more.
| Trading style | Typical holding idea | Main chart focus |
|---|---|---|
| Intraday trading | Entry and exit on the same day | Short-term price action and intraday momentum |
| Swing trading | More than one session, commonly several days | Daily trend, support and resistance, volume |
| Positional trading | A longer trend lasting weeks, months or more | Broader trend, business context and valuation |
The holding period changes the trader's working routine. Intraday decisions depend on price action during the session. Swing traders often study the daily chart, support and resistance, and volume before accepting overnight exposure. Positional traders give a larger market or business thesis more time to develop.
The market education material describes swing trading as a short-to-medium-term strategy seeking directional moves over a few days to several weeks. A daily close can therefore carry more weight than a brief move during market hours. For example, a close above a marked resistance area may support a swing-trading decision more clearly than a temporary move above it.
Time horizon changes the risk
Intraday trading avoids carrying a position overnight, but it requires close attention and quick decisions. Swing trading allows more time between decisions, while exposing the trader to overnight and weekend gaps. Company announcements, global market moves or other news can change the next opening price before an order can be placed.
Positional trading gives a thesis longer to develop. It also keeps capital committed for longer and exposes the holder to more market events. The choice depends on available time, attention, experience and tolerance for uncertainty.
Settlement creates another practical difference in India. A swing trade in the cash market can become a delivery position, with shares and funds processed through the applicable settlement cycle. That experience differs from same-day trading and from derivatives activity, where risk can change quickly. SEBI's investor market education material can help readers distinguish these market activities.
For a same-day comparison, read this intraday trading calls explainer. Swing trading is not intraday trading performed less often. Its longer holding period requires a different entry plan, overnight-risk assessment and exit rule.
Timeframes Settlement and Costs Behind Every Swing Trade in India
A swing trade in India can last only a few sessions, yet its practical result depends on settlement, delivery status, taxes and charges. The chart may show an entry and exit, while the back office still has to process shares and funds.
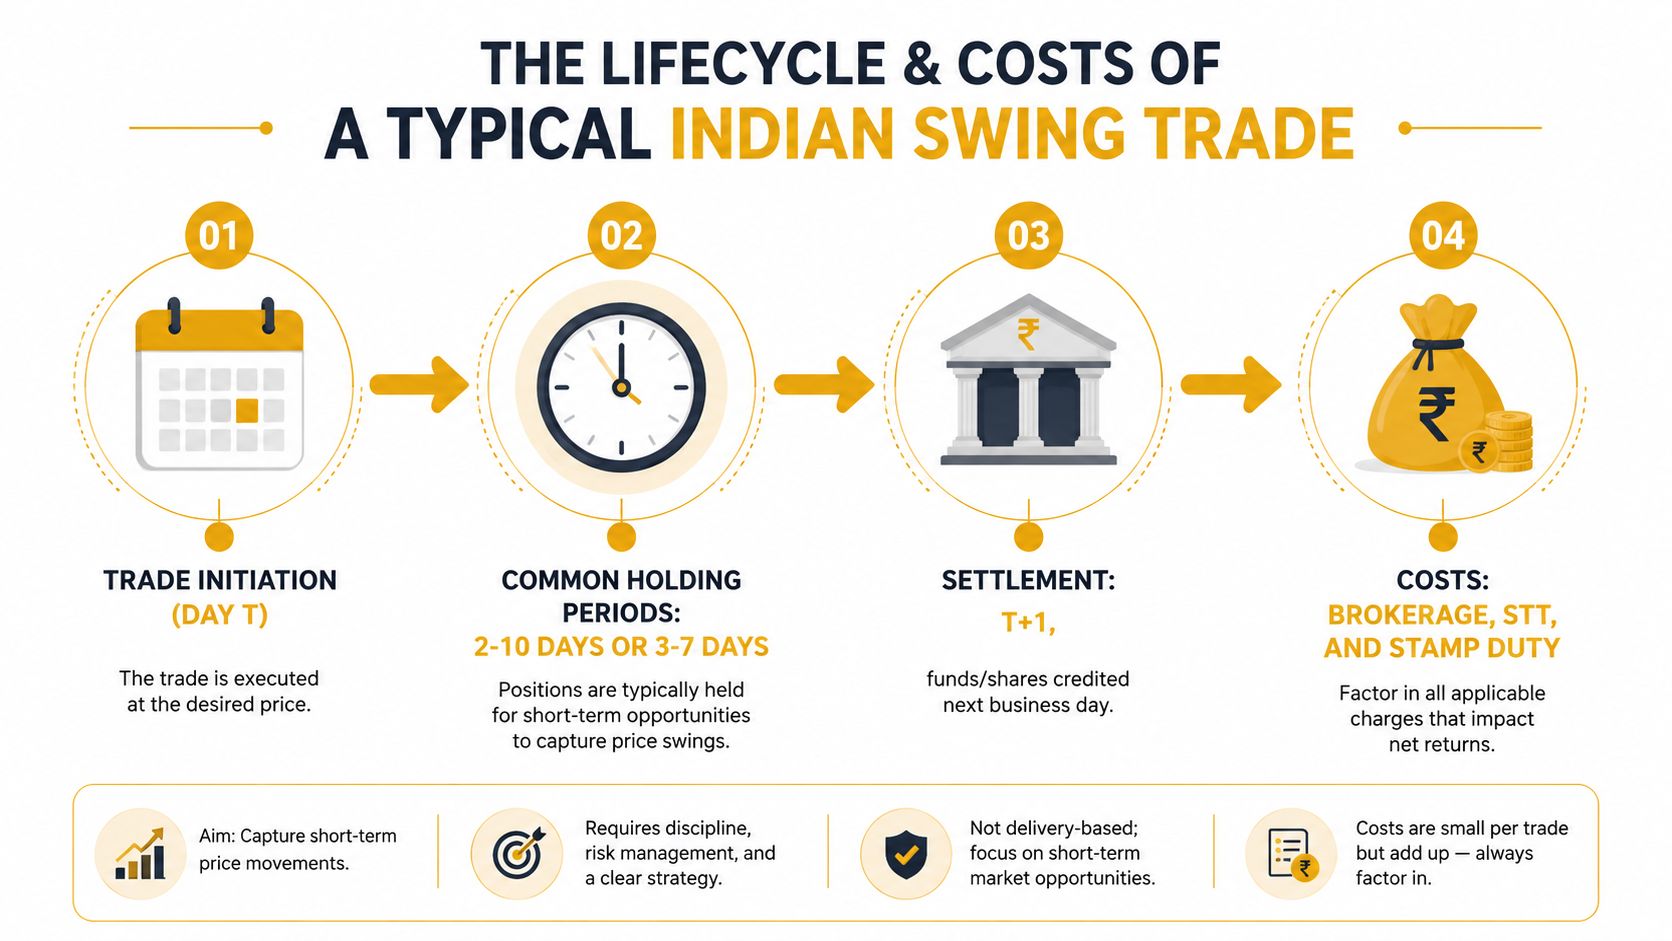
A common India-specific benchmark is a 2 to 10 trading-day hold for NSE-listed stocks. Some educational and market-research sources describe 3 to 7 days as a common swing window, as noted in this NSE educational document. A shorter hold limits the time exposed to overnight events. A longer hold gives a trend more time to continue after a breakout, while leaving the position exposed for longer. Neither timeframe prevents a failed setup.
What T+1 means
India's cash-equity market follows T+1 settlement. For a trade executed on day T, provisional obligations are set on T. Final obligations are generated by 8:30 am on T+1, and securities and funds pay-in and pay-out also occur on T+1, according to the NSE settlement-cycle explanation. In plain terms, delivery is completed on the second working day after the trade date.
Members with a funds pay-in obligation must have clear funds in the primary clearing account on or before 9:00 am on settlement day, as specified by NSE Clearing. This does not change the trading idea, but it explains why available cash and delivery status matter. A cash-market swing position therefore has an operational layer that differs from a same-day trade or margin-based F&O activity.
Corporate announcements can change the position during its holding period. Bharatstox surfaces NSE and BSE filings and explains them in plain language. Readers can also examine this guide to corporate action events to understand how such announcements may affect a holding.
Taxes and transaction costs
For listed equity shares and equity-oriented mutual fund units, a holding period of 12 months or less falls under the short-term capital-gains test. More than 12 months is treated as long-term, while gains within that period are short-term, according to this India tax explainer. Because swing trades are generally planned for days or weeks, their gains generally fall within the short-term category.
The net result also includes brokerage, securities transaction tax, stamp duty and other applicable charges. A delivery-based swing-trading guide discusses these costs using a ₹50,000 delivery trade example, but the exact amount depends on the transaction and applicable charges. The chart pattern is only one part of the decision. Entry price, holding period, settlement, tax treatment and trading friction all shape the final outcome.
Popular Swing Trading Setups and How to Read Them
A setup is a repeatable chart situation, not a forecast. It gives the trader a framework for describing price action and identifying what evidence would weaken that interpretation. On Indian equities, the daily chart is usually the starting point because a swing position may remain open across several trading sessions and settle through the delivery process.
The trader marks trend direction, support and resistance, the shape of consolidation, and the relationship between price and participation. Minute-by-minute movement can distract from that larger structure, much like judging a road trip from one turn instead of the route as a whole.
Pullback within an uptrend
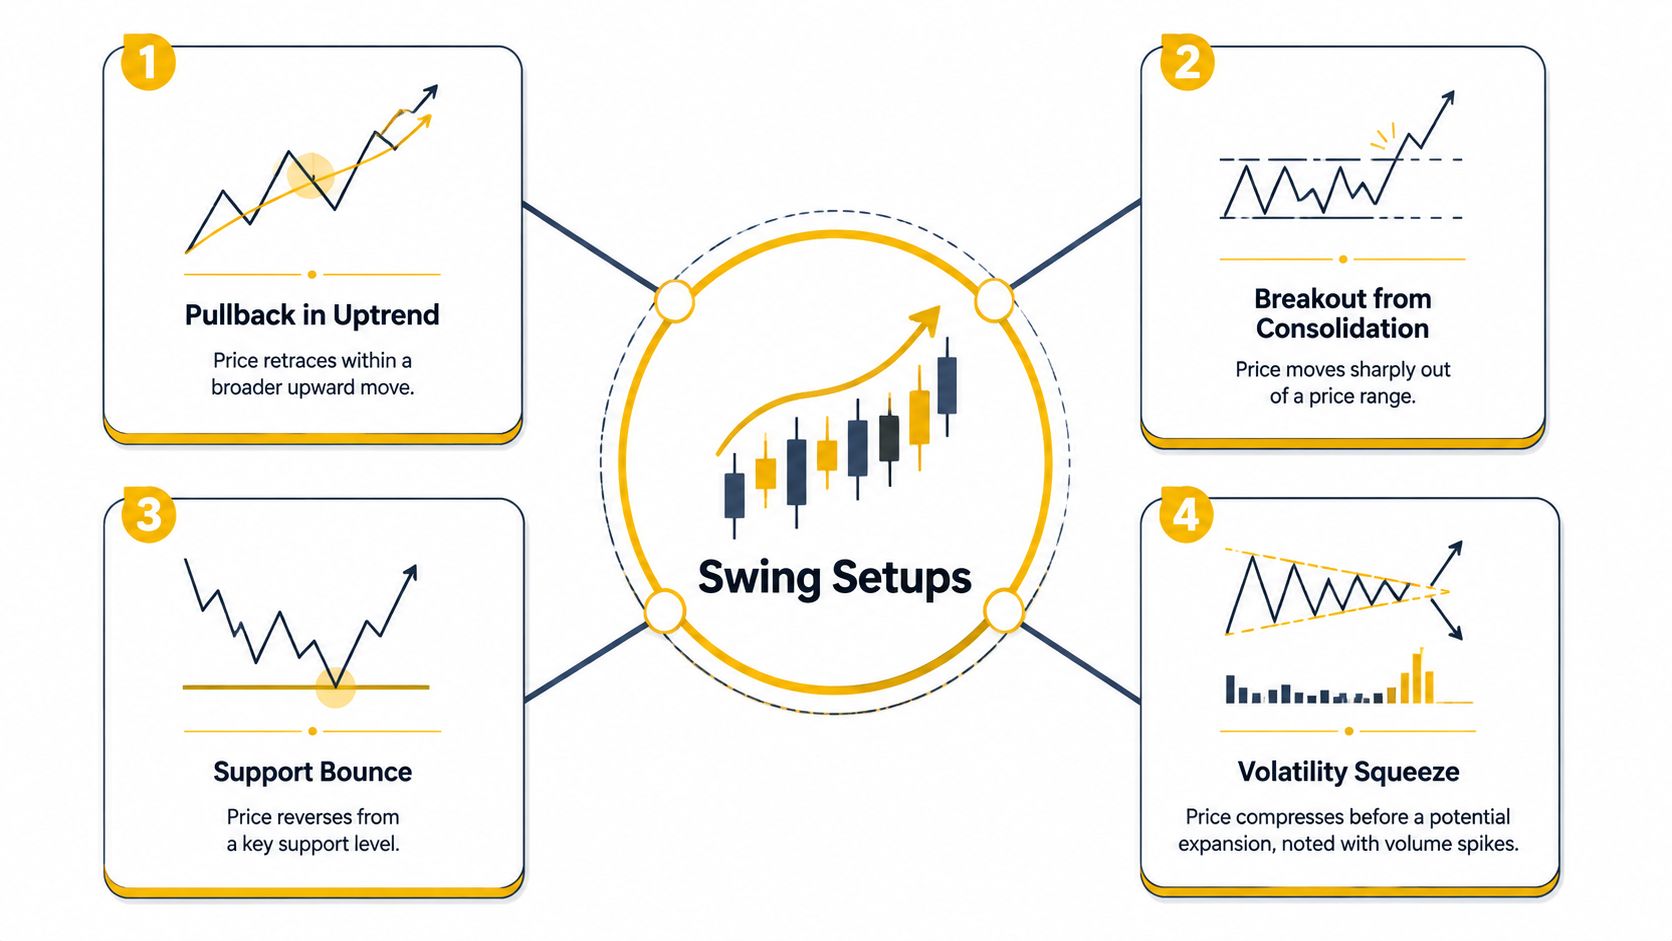
A pullback is a temporary decline within a broader upward move. The trader checks whether price is retracing towards a previously important area while the larger sequence of higher highs and higher lows remains intact. A falling price is not automatically a buying opportunity.
Volume during the retracement is also read in relation to sector strength. If activity contracts while leading stocks in the same sector continue to hold their structure, the decline may reflect rotation or profit-taking rather than a broad change in demand. A sector rotation chart guide can help place that participation shift in context. The setup becomes less convincing if price breaks broader support or selling remains strong across the sector.
Breakout from consolidation
Consolidation is a period in which price moves within a defined range. A breakout occurs when price leaves that range. Traders often look for a daily close beyond resistance with stronger volume, since wider participation can make the move more meaningful than a brief intraday spike.
The main risk is a false breakout. Price may cross the range boundary and then return inside it. A daily close back within the old range signals that the original reading needs reassessment.
Support bounce and volatility squeeze
A support bounce describes price declining towards an area where buyers previously appeared, then reversing. Support is not a guaranteed floor. It is a zone where the market showed earlier demand, so the response must be observed rather than assumed.
A volatility squeeze occurs when price movement compresses into a narrower range. The next expansion may occur in either direction. A volume spike during that expansion describes increased participation, but it does not identify the direction by itself.
Read each setup in sequence: identify the daily trend, mark nearby structure, examine participation, and define the condition that would invalidate the interpretation. Overnight news remains a risk because the next opening price may differ from the previous close.
Indicators and Trade Management Essentials for Swing Traders
Indicators are measurement tools, not decision machines. They summarise price, momentum or participation, but each one depends on the underlying chart and the timeframe selected.
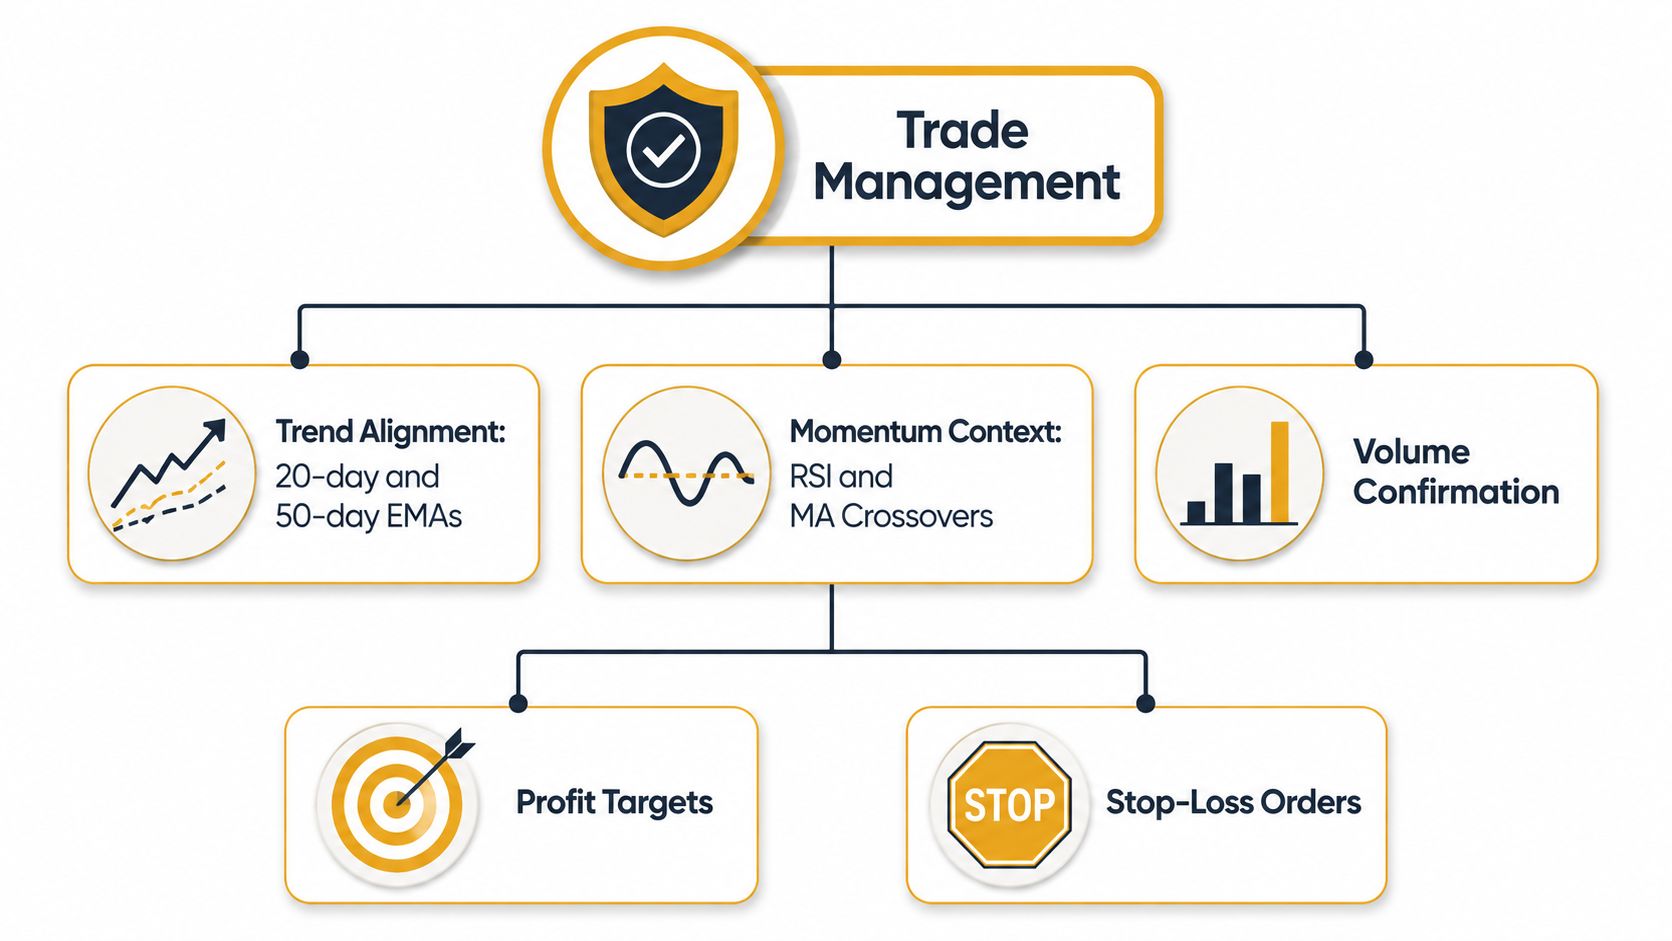
Many Indian swing traders use the 20-day EMA and 50-day EMA to study trend alignment. An EMA, or exponential moving average, gives greater weight to recent prices. Price holding above a rising 20-day EMA while the 50-day EMA supports the broader direction can describe an aligned trend. It doesn't establish that the next move will continue.
Momentum and participation
The RSI, or Relative Strength Index, is a momentum indicator. It helps traders assess whether recent price movement has been strong or weak relative to its recent history. A moving-average crossover compares one average with another to provide additional momentum context. Neither tool should be read without considering support, resistance and the actual price pattern.
Volume answers a different question. It shows how actively the stock traded during a session. A breakout accompanied by increased volume may indicate broader participation, while lower volume during a consolidation or pullback can provide context about the balance between buyers and sellers.
Risk planning before execution
Trade management begins before a position is opened. A trader can write down the setup, the reason for considering it, the expected holding window and the condition that would show the idea has failed. That condition is often called invalidation.
Position sizing connects the chart to the account. If a stock's ordinary daily movement is large, a position that is too large may create emotional pressure and force an early exit. The aim of sizing is educationally clear, to ensure that normal volatility doesn't decide the trade for the trader.
A stop-loss order is one possible risk-control mechanism, but it isn't a guarantee of execution at a chosen price, particularly during a gap. Profit targets also require context. A target should come from the structure being studied, not from a promise that the market will reach it.
Tax and transaction charges belong in the same calculation. As explained earlier, the 12-month-or-less holding-period test generally places a swing trade in the short-term category, but the net outcome still depends on the actual gain, costs and applicable tax rules.
This is for informational and educational purposes only and not investment advice. Consult a SEBI-registered adviser before investing.
Sample Swing Trade Illustrations on NSE and BSE Stocks
A swing-trade example is most useful when it shows decision-making without turning a particular stock into a recommendation. The chart, holding period and possible failure point matter more than a promised price target.
Consider a hypothetical NSE-listed stock forming higher highs and higher lows on its daily chart. The price retreats towards its 20-day EMA while volume decreases. The trader then checks whether the price stabilises around that reference area and later closes above the recent swing high with stronger participation.
The sequence is the lesson:
- Trend: The daily structure points upward.
- Retracement: Price returns towards a reference area instead of extending immediately.
- Participation: Volume becomes quieter during the pullback.
- Confirmation: A close above nearby resistance gives the trader evidence to assess.
- Invalidation: A decisive break below the structure weakens the original interpretation.
An educational position based on this setup would be reviewed across several sessions, rather than minute by minute. Since the position remains open overnight, an announcement can create a gap and change the next opening price. In India, T+1 settlement also means a delivery-based cash-equity trade follows the exchange settlement cycle, unlike a position opened and closed within the same session.
A range-break illustration
A second example begins with a stock trading inside a clear range. Repeated tests of the upper boundary make that level visible on the daily chart, while volume stays relatively subdued. One session then closes above the range with noticeably higher activity.
This pattern is called a range breakout. The trader examines whether price holds above the former boundary, whether the breakout quickly reverses and whether the wider market supports or conflicts with the setup. The practical question is whether the evidence supports the trade idea and what would show that the breakout has failed.
Swing trades generally occupy more than one session and often last from the short to medium term, rather than remaining intraday or becoming a long-term investment. These examples are chart-reading exercises, not guaranteed outcomes or calls on any specific NSE or BSE security.
Delivery-based equity trades may also have short-term tax and transaction-cost effects, so the apparent chart move is not the same as the final result. A clean pattern can still be affected by liquidity, corporate events, overnight gaps or a sudden change in market conditions. Past patterns do not guarantee future results, and a cash-equity illustration should not be treated as evidence that F&O speculation carries the same risk.
Key Takeaways and Common Misconceptions About Swing Trading
Swing trading is a multi-session cash-equity approach built around a defined price move. It relies on daily-chart structure, support and resistance, momentum context, volume and a written idea about what would invalidate the setup.
The most common misconception is that a slower pace makes the strategy safe. Swing trading can reduce the number of decisions compared with intraday activity, but it still carries overnight exposure, execution risk, transaction costs and behavioural pressure. It also isn't automatically safer if the trader shifts from delivery-based equity positions into derivatives.
SEBI's September 2024 retail trading study found that 93% of individual futures-and-options traders lost money over FY22 to FY24, with total losses exceeding ₹1.8 lakh crore and average losses of about ₹2 lakh per trader, according to the reported SEBI study details. The findings concern F&O rather than swing trading alone, so they shouldn't be presented as a swing-trading statistic. They do, however, provide important Indian context for anyone tempted to treat a faster version of a cash-equity strategy as a quick win.
A practical learning checklist is:
- Define the horizon: Decide whether the idea is intraday, swing or positional before reading the chart.
- Use daily structure: Mark trend, support, resistance and volume before adding indicators.
- Plan invalidation: Write down what would show that the original interpretation has weakened.
- Check mechanics: Account for T+1 settlement, delivery status, charges and tax treatment.
- Avoid borrowed funds drift: Don't assume a cash-equity setup transfers safely to F&O.
- Review decisions: Record the reasoning, execution and outcome without judging success from one trade.
This is for informational and educational purposes only and not investment advice. Consult a SEBI-registered adviser before investing.
Bharatstox publishes NSE and BSE market journalism, corporate filing explanations, live market panels and attributed research calls with visible analyst details and timestamps. Visit Bharatstox to follow the market context and read further explainers on the mechanics behind swing trading.
Disclaimer
This article is for informational and educational purposes only and does not constitute investment advice or a recommendation. Investing in securities markets is subject to market risks. Read all related documents carefully before investing.